

doi: 10.1111/j.1471-8286.2007.01758.x.
Inference of population structure using multilocus genotype data: dominant markers and null alleles
- PMID: 18784791
- PMCID: PMC1974779
- DOI: 10.1111/j.1471-8286.2007.01758.x
Item in Clipboard
Inference of population structure using multilocus genotype data: dominant markers and null alleles
Mol Ecol Notes.
.
Abstract
Dominant markers such as amplified fragment length polymorphisms (AFLPs) provide an economical way of surveying variation at many loci. However, the uncertainty about the underlying genotypes presents a problem for statistical analysis. Similarly, the presence of null alleles and the limitations of genotype calling in polyploids mean that many conventional analysis methods are invalid for many organisms. Here we present a simple approach for accounting for genotypic ambiguity in studies of population structure and apply it to AFLP data from whitefish. The approach is implemented in the program structure version 2.2, which is available from http://pritch.bsd.uchicago.edu/structure.html.
Figures
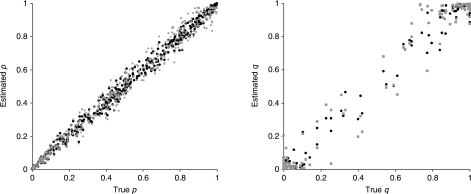
Comparison of estimated gene frequencies p and admixture proportions q with true values, for simulated data from two closely related populations. Black points show estimates for codominant markers. Grey points show estimates where allele 1 is dominant over allele 0. p represents the frequency of allele 1.
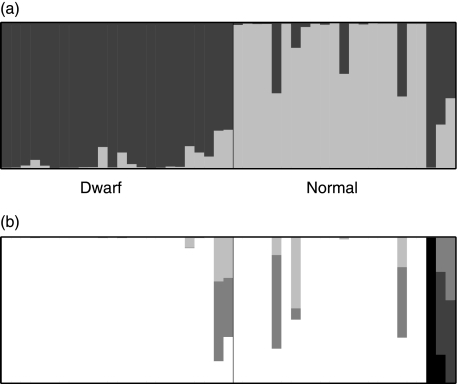
Ancestry of whitefish from Cliff Lake estimated using structure . (a) Ancestry estimates based on naïve clustering. Ancestry from the inferred dwarf and normal gene pools are shown in dark and light grey, respectively. (b) Likely ancestry of each individual, estimated using phenotypic information. White: full ancestry from observed ecotype. Light grey: one great grandparent with other ecotype. Grey: one grand parent with other ecotype. Dark grey: one parent with other ecotype. Black: both parents from other ecotype. See text for model details.
References
-
- Albert V, Jonsson B, Bernatchez L. Natural hybrids in Atlantic eels (Anguilla anguilla, A. rostrata): evidence for successful reproduction and fluctuating abundance in space and time. Molecular Ecology. 2006;15:1903–1191. - PubMed
-
- Brookfield JFY. A simple new method for estimating null allele frequencies from heterozygote deficiency. Molecular Ecology. 1996;5:453–455. - PubMed
-
- Campbell D, Bernatchez L. Generic scan using AFLP markers as a means to assess the role of directional selection in the divergence of sympatric whitefish ecotypes. Molecular Biology and Evolution. 2004;21:945–956. - PubMed
-
- Campbell D, Duchesne P, Bernatchez L. AFLP utility for population assignment studies: analytical investigation and empirical comparison with microsatellites. Molecular Ecology. 2003;12:1979–1991. - PubMed
-
- Devlin B, Roeder K. Genomic control for association studies. Biometrics. 1999;55:997–1004. - PubMed
LinkOut - more resources
Full Text Sources
Other Literature Sources