. 2008 Oct 15;23(13):1830-6.
doi: 10.1002/mds.22097.

Ten-year rate of longitudinal change in neurocognitive and motor function in prediagnosis Huntington disease

Affiliations

Ten-year rate of longitudinal change in neurocognitive and motor function in prediagnosis Huntington disease

Andrea C Solomon et al. Mov Disord. .

Abstract

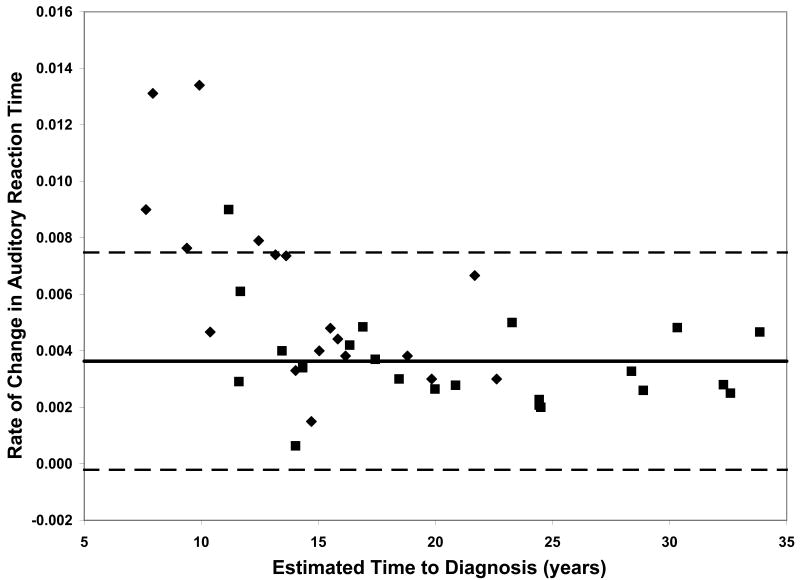
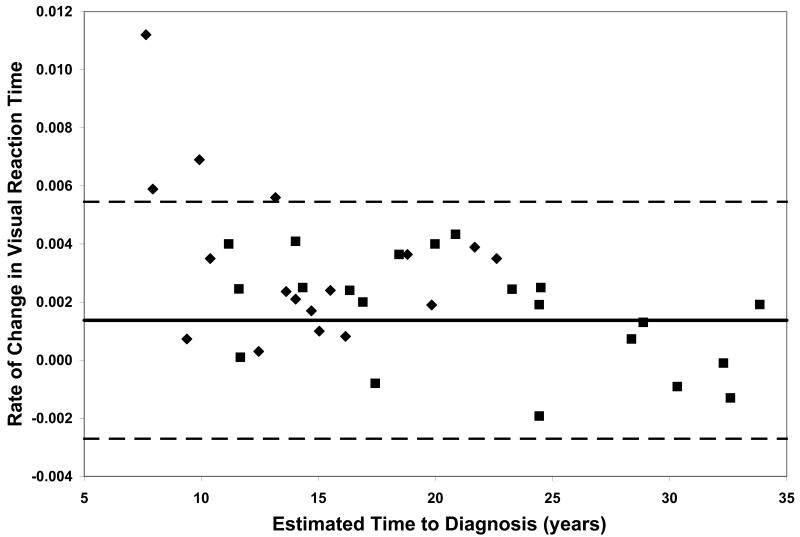
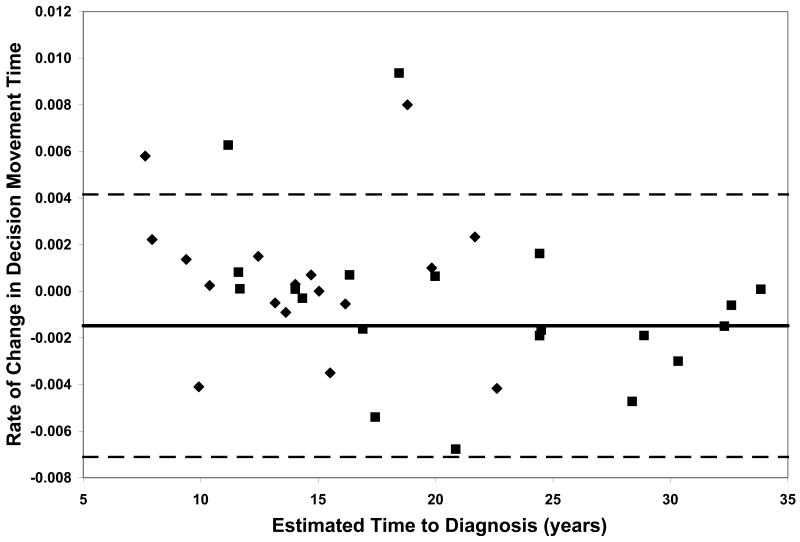
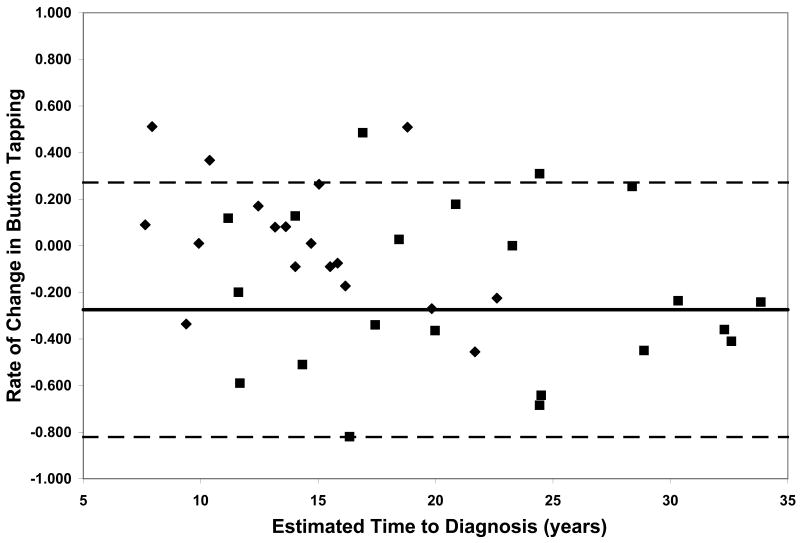
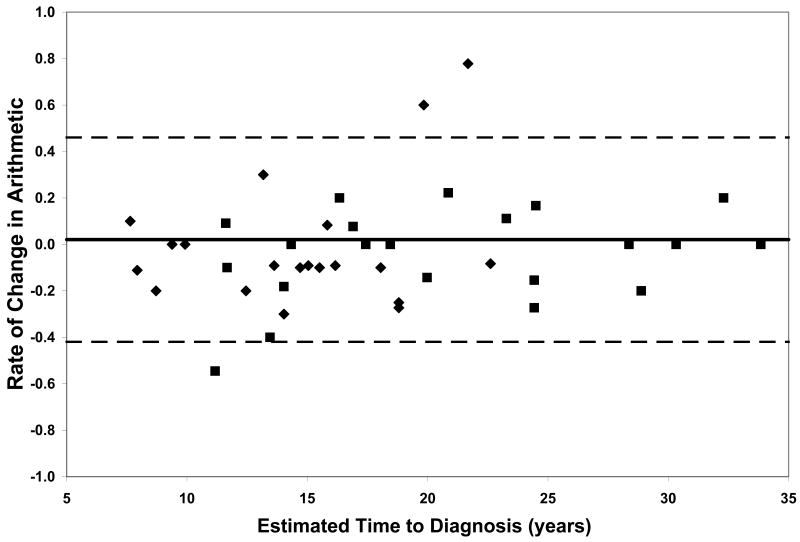
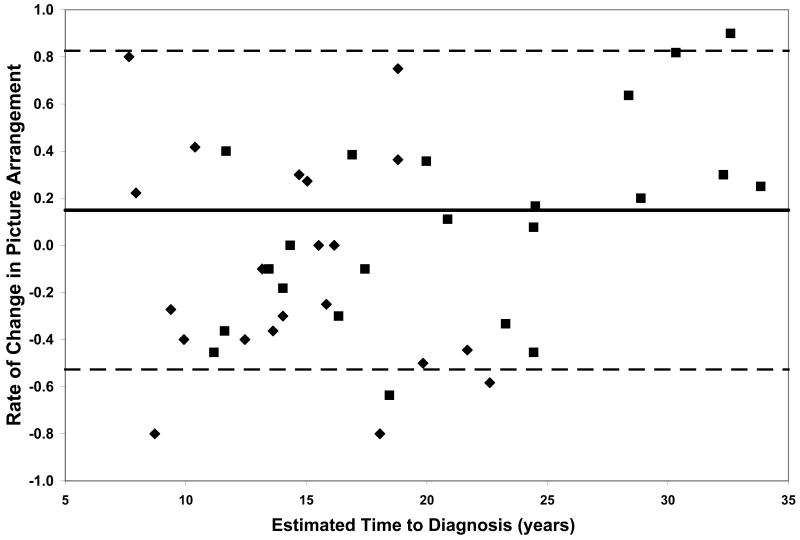
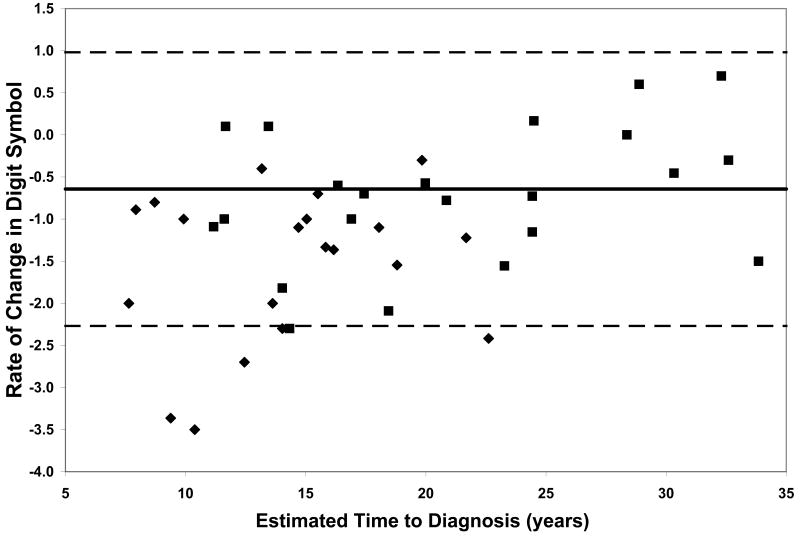
Longitudinal studies of neurocognitive function in prediagnosis Huntington disease (pre-HD) have been few, and duration of follow-up has been brief. In this study, 155 individuals at-risk for HD completed a battery of cognitive and motor tasks at two study visits approximately 10 years apart. Participants were classified as: (1) at-risk, without the CAG expansion (healthy controls, NC; n = 112), or (2) CAG expanded (CAG+; n = 43). To examine the rate of decline at different stages of the pre-HD period, participants in the CAG+ group were further characterized as converters (i.e., individuals who developed manifest HD over the course of the study; n = 21) or nonconverters (n = 22), and their performances were compared. The CAG+ group exhibited faster rates of neurocognitive decline over the course of the study, relative to the NC group. In addition, more rapid decline was associated with closer proximity to estimated age of disease onset in the CAG+ group. Faster rates of motor and psychomotor decline were observed in the CAG+ converter group, relative to the nonconverters. These findings suggest that neurocognitive decline in pre-HD, particularly in motor and psychomotor domains, begins insidiously and accelerates as individuals approach disease onset.


Figures

Figure 1
Figure 1
Performance of the CAG+ group on study measures. The CAG+ converters are shown with a diamond, the CAG+ nonconverters are shown with a square. The thick black line represents the mean rate of change for the NC group (CAG-). The dashed lines represent ± 2 standard deviations of the mean for the NC group. A. Auditory Reaction Time; B. Visual Reaction Time; C. Decision Reaction Time; D. Movement Time; E. Decision Movement Time; F. Button Tapping; G. WAIS-R Arithmetic; H. WAIS-R Picture Arrangement; I. WAIS-R Digit Symbol
Figure 1
Figure 1
Performance of the CAG+ group on study measures. The CAG+ converters are shown with a diamond, the CAG+ nonconverters are shown with a square. The thick black line represents the mean rate of change for the NC group (CAG-). The dashed lines represent ± 2 standard deviations of the mean for the NC group. A. Auditory Reaction Time; B. Visual Reaction Time; C. Decision Reaction Time; D. Movement Time; E. Decision Movement Time; F. Button Tapping; G. WAIS-R Arithmetic; H. WAIS-R Picture Arrangement; I. WAIS-R Digit Symbol

Similar articles

  • Progression in prediagnostic Huntington disease.
    Rupp J, Blekher T, Jackson J, Beristain X, Marshall J, Hui S, Wojcieszek J, Foroud T. Rupp J, et al. J Neurol Neurosurg Psychiatry. 2010 Apr;81(4):379-84. doi: 10.1136/jnnp.2009.176982. Epub 2009 Sep 1. J Neurol Neurosurg Psychiatry. 2010. PMID: 19726414 Free PMC article.
  • Neurocognitive signs in prodromal Huntington disease.
    Stout JC, Paulsen JS, Queller S, Solomon AC, Whitlock KB, Campbell JC, Carlozzi N, Duff K, Beglinger LJ, Langbehn DR, Johnson SA, Biglan KM, Aylward EH. Stout JC, et al. Neuropsychology. 2011 Jan;25(1):1-14. doi: 10.1037/a0020937. Neuropsychology. 2011. PMID: 20919768 Free PMC article.
  • Cognitive decline in Huntington's disease expansion gene carriers.
    Baake V, Reijntjes RHAM, Dumas EM, Thompson JC; REGISTRY Investigators of the European Huntington's Disease Network; Roos RAC. Baake V, et al. Cortex. 2017 Oct;95:51-62. doi: 10.1016/j.cortex.2017.07.017. Epub 2017 Aug 3. Cortex. 2017. PMID: 28843844
  • Clinical-Genetic Associations in the Prospective Huntington at Risk Observational Study (PHAROS): Implications for Clinical Trials.
    Huntington Study Group PHAROS Investigators; Biglan KM, Shoulson I, Kieburtz K, Oakes D, Kayson E, Shinaman MA, Zhao H, Romer M, Young A, Hersch S, Penney J, Marder K, Paulsen J, Quaid K, Siemers E, Tanner C, Mallonee W, Suter G, Dubinsky R, Gray C, Nance M, Bundlie S, Radtke D, Kostyk S, Baic C, Caress J, Walker F, Hunt V, O'Neill C, Chouinard S, Factor S, Greenamyre T, Wood-Siverio C, Corey-Bloom J, Song D, Peavy G, Moskowitz C, Wesson M, Samii A, Bird T, Lipe H, Blindauer K, Marshall F, Zimmerman C, Goldstein J, Rosas D, Novak P, Caviness J, Adler C, Duffy A, Wheelock V, Tempkin T, Richman D, Seeberger L, Albin R, Chou KL, Racette B, Perlmutter JS, Perlman S, Bordelon Y, Martin W, Wieler M, Leavitt B, Raymond L, Decolongon J, Clarke L, Jankovic J, Hunter C, Hauser RA, Sanchez-Ramos J, Furtado S, Suchowersky O, Klimek ML, Guttman M, Sethna R, Feigin A, Cox M, Shannon B, Percy A, Dure L, Harrison M, Johnson W, Higgins D, Molho E, Nickerson C, Evans S, Hobson D, Singer C, Galvez-Jimenez N, Shannon K, Comella C, Ross C, Saint-Hilaire MH, Testa C, Rosenblatt A, Hogarth P, Weiner W, Como P, Kumar R, Cotto C, Stout J, Brocht A, Watts A, Eberly S, Weaver C, Foroud T, Gusella J, MacDona… See abstract for full author list ➔ Huntington Study Group PHAROS Investigators, et al. JAMA Neurol. 2016 Jan;73(1):102-10. doi: 10.1001/jamaneurol.2015.2736. JAMA Neurol. 2016. PMID: 26569098
  • CAG-repeat length and the age of onset in Huntington disease (HD): a review and validation study of statistical approaches.
    Langbehn DR, Hayden MR, Paulsen JS; and the PREDICT-HD Investigators of the Huntington Study Group. Langbehn DR, et al. Am J Med Genet B Neuropsychiatr Genet. 2010 Mar 5;153B(2):397-408. doi: 10.1002/ajmg.b.30992. Am J Med Genet B Neuropsychiatr Genet. 2010. PMID: 19548255 Free PMC article. Review.

Cited by

References

    1. Huntington's Disease Collaborative Research Group A novel gene containing a trinucleotide repeat that is expanded and unstable on Huntington's disease chromosomes. Cell. 1993;72:971–983. - PubMed
    1. Feigin A, Ghilardi MF, Huang C, et al. Preclinical Huntington's disease: compensatory brain responses during learning. Ann Neurol. 2006;59:53–59. - PMC - PubMed
    1. Foroud T, Siemers E, Kleindorfer D, et al. Cognitive scores in carriers of Huntington's disease gene compared to noncarriers. Ann Neurol. 1995;37:657–664. - PubMed
    1. Gomez-Anson B, Alegret M, Munoz E, Sainz A, Monte GC, Tolosa E. Decreased frontal choline and neuropsychological performance in preclinical Huntington disease. Neurology. 2007;68:906–910. - PubMed
    1. Johnson SA, Stout JC, Solomon AC, et al. Beyond disgust: impaired recognition of negative emotions prior to diagnosis in Huntington's disease. Brain. 2007;130:1732–1744. - PubMed

Publication types