

Improved sequence tag generation method for peptide identification in tandem mass spectrometry
- PMID: 18785767
- PMCID: PMC3744226
- DOI: 10.1021/pr800400q
Improved sequence tag generation method for peptide identification in tandem mass spectrometry
Abstract
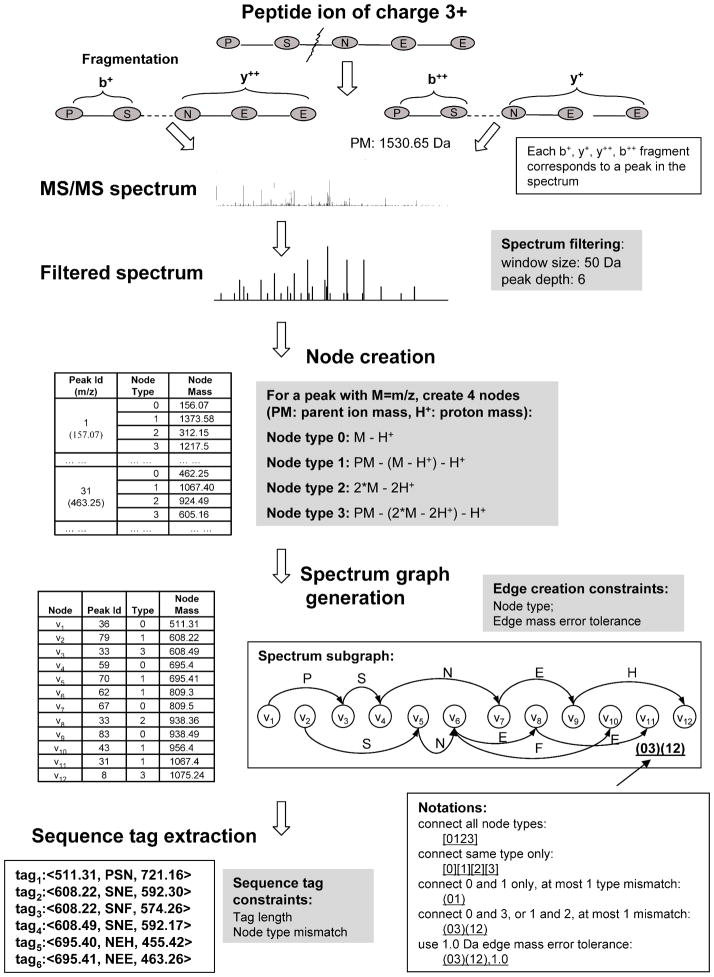
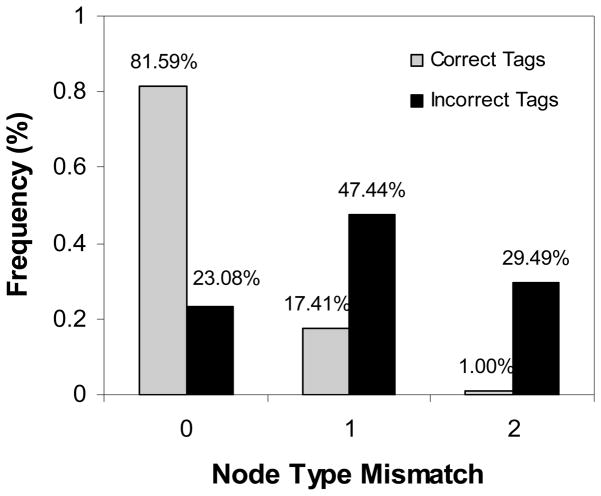
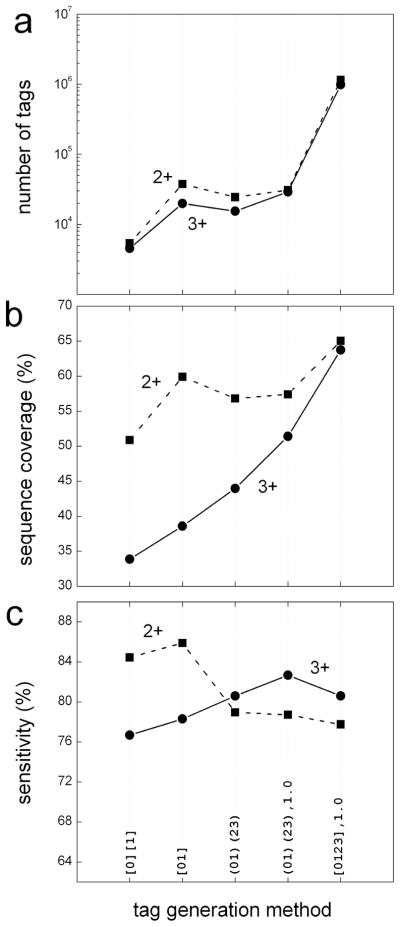
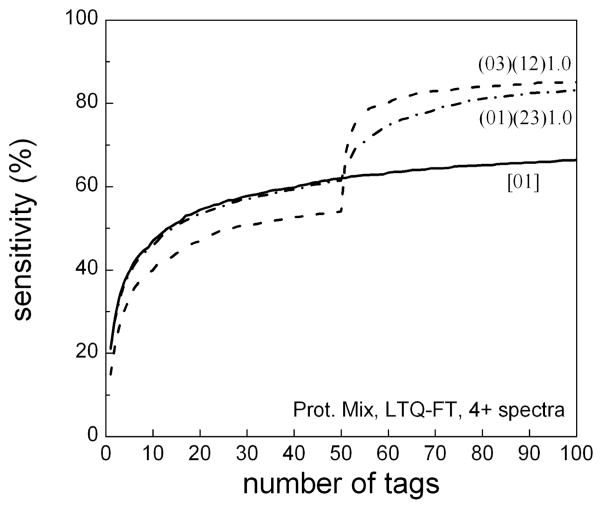
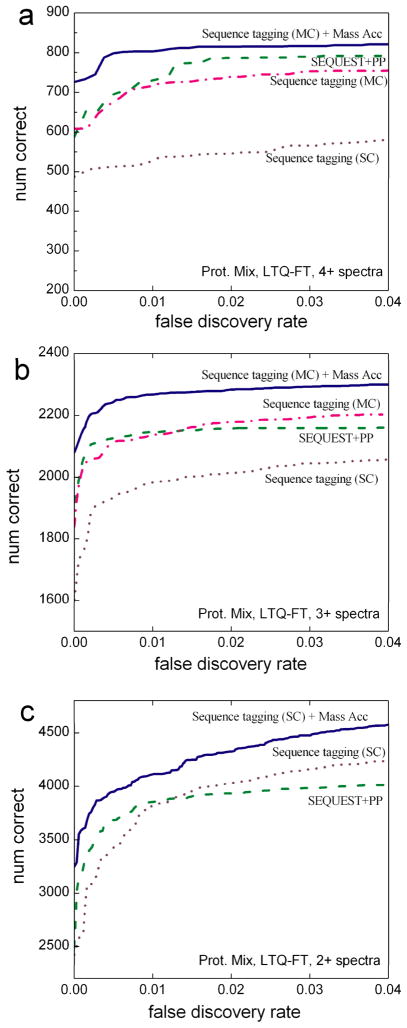
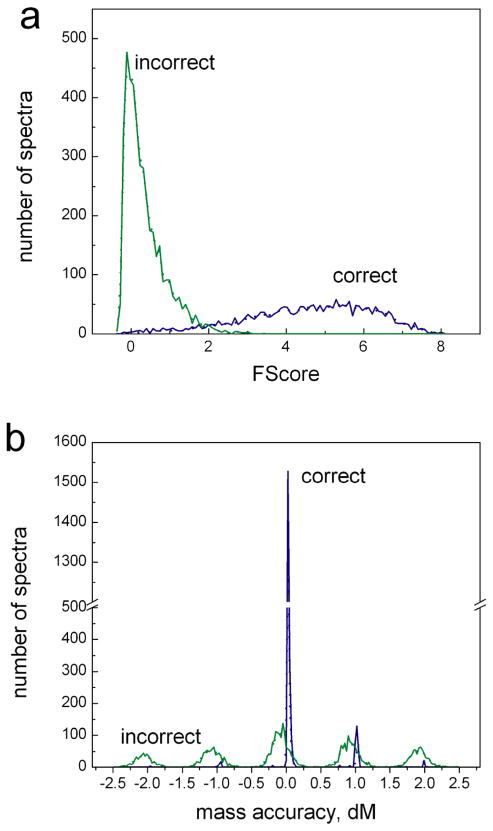
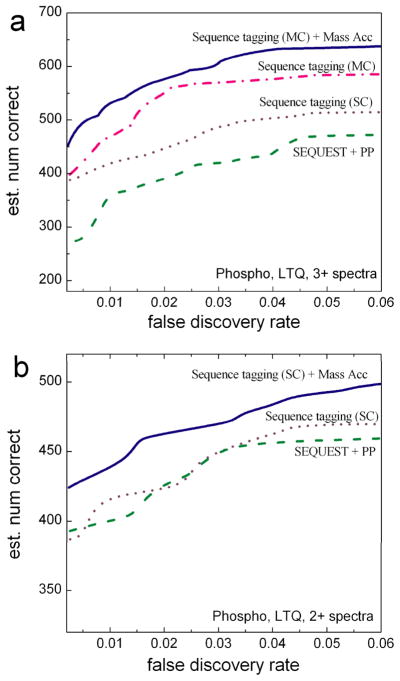
The sequence tag-based peptide identification methods are a promising alternative to the traditional database search approach. However, a more comprehensive analysis, optimization, and comparison with established methods are necessary before these methods can gain widespread use in the proteomics community. Using the InsPecT open source code base ( Tanner et al., Anal. Chem. 2005, 77, 4626- 39 ), we present an improved sequence tag generation method that directly incorporates multicharged fragment ion peaks present in many tandem mass spectra of higher charge states. We also investigate the performance of sequence tagging under different settings using control data sets generated on five different types of mass spectrometers, as well as using a complex phosphopeptide-enriched sample. We also demonstrate that additional modeling of InsPecT search scores using a semiparametric approach incorporating the accuracy of the precursor ion mass measurement provides additional improvement in the ability to discriminate between correct and incorrect peptide identifications. The overall superior performance of the sequence tag-based peptide identification method is demonstrated by comparison with a commonly used SEQUEST/PeptideProphet approach.
Figures
Similar articles
-
Characterization of strategies for obtaining confident identifications in bottom-up proteomics measurements using hybrid FTMS instruments.Anal Chem. 2008 Nov 15;80(22):8514-25. doi: 10.1021/ac801376g. Epub 2008 Oct 15. Anal Chem. 2008. PMID: 18855412 Free PMC article.
-
Statistical validation of peptide identifications in large-scale proteomics using the target-decoy database search strategy and flexible mixture modeling.J Proteome Res. 2008 Jan;7(1):286-92. doi: 10.1021/pr7006818. Epub 2007 Dec 14. J Proteome Res. 2008. PMID: 18078310
-
SQID: an intensity-incorporated protein identification algorithm for tandem mass spectrometry.J Proteome Res. 2011 Apr 1;10(4):1593-602. doi: 10.1021/pr100959y. Epub 2011 Feb 23. J Proteome Res. 2011. PMID: 21204564 Free PMC article.
-
Protein identification by tandem mass spectrometry and sequence database searching.Methods Mol Biol. 2007;367:87-119. doi: 10.1385/1-59745-275-0:87. Methods Mol Biol. 2007. PMID: 17185772 Review.
-
A face in the crowd: recognizing peptides through database search.Mol Cell Proteomics. 2011 Nov;10(11):R111.009522. doi: 10.1074/mcp.R111.009522. Epub 2011 Aug 29. Mol Cell Proteomics. 2011. PMID: 21876205 Free PMC article. Review.
Cited by
-
Speeding up tandem mass spectral identification using indexes.Bioinformatics. 2012 Jul 1;28(13):1692-7. doi: 10.1093/bioinformatics/bts244. Epub 2012 Apr 27. Bioinformatics. 2012. PMID: 22543365 Free PMC article.
-
A survey of computational methods and error rate estimation procedures for peptide and protein identification in shotgun proteomics.J Proteomics. 2010 Oct 10;73(11):2092-123. doi: 10.1016/j.jprot.2010.08.009. Epub 2010 Sep 8. J Proteomics. 2010. PMID: 20816881 Free PMC article. Review.
-
Validation of De Novo Peptide Sequences with Bottom-Up Tag Convolution.Proteomes. 2021 Dec 29;10(1):1. doi: 10.3390/proteomes10010001. Proteomes. 2021. PMID: 35076636 Free PMC article.
-
Towards an understanding of wheat chloroplasts: a methodical investigation of thylakoid proteome.Mol Biol Rep. 2012 May;39(5):5069-83. doi: 10.1007/s11033-011-1302-4. Epub 2011 Dec 11. Mol Biol Rep. 2012. PMID: 22160430
-
Systematic Evaluation of Protein Sequence Filtering Algorithms for Proteoform Identification Using Top-Down Mass Spectrometry.Proteomics. 2018 Feb;18(3-4):10.1002/pmic.201700306. doi: 10.1002/pmic.201700306. Epub 2018 Feb 6. Proteomics. 2018. PMID: 29327814 Free PMC article.
References
-
- Hernandez P, Müller M, Appel RD. Automated protein identification by tandem mass spectrometry: Issues and strategies. Mass Spectrometry Reviews. 2006;25(2):235–254. - PubMed
-
- Nesvizhskii AI. Protein identification by tandem mass spectrometry and sequence database searching. Methods Mol Biol. 2007;367:87–119. - PubMed
-
- Xu C, Ma B. Software for computational peptide identification from MS-MS data. Drug Discovery Today. 2006;11(13–14):595–600. - PubMed
-
- Keller A, Nesvizhskii AI, Kolker E, Aebersold R. Empirical Statistical Model To Estimate the Accuracy of Peptide Identifications Made by MS/MS and Database Search. Anal Chem. 2002;74(20):5383–5392. - PubMed
-
- Bern M, Cai Y, Goldberg D. Lookup Peaks: A Hybrid of de Novo Sequencing and Database Search for Protein Identification by Tandem Mass Spectrometry. Anal Chem. 2007;79(4):1393–1400. - PubMed
Publication types
MeSH terms
Substances
Grants and funding
LinkOut - more resources
Full Text Sources
Other Literature Sources
Molecular Biology Databases
