. 2008 Nov;154(2):270-84.
doi: 10.1111/j.1365-2249.2008.03753.x. Epub 2008 Sep 8.

Non-obese diabetic-recombination activating gene-1 (NOD-Rag1 null) interleukin (IL)-2 receptor common gamma chain (IL2r gamma null) null mice: a radioresistant model for human lymphohaematopoietic engraftment

Affiliations

Non-obese diabetic-recombination activating gene-1 (NOD-Rag1 null) interleukin (IL)-2 receptor common gamma chain (IL2r gamma null) null mice: a radioresistant model for human lymphohaematopoietic engraftment

T Pearson et al. Clin Exp Immunol. 2008 Nov.

Abstract

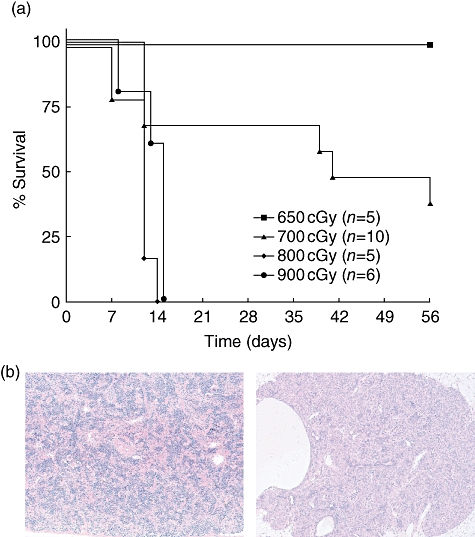
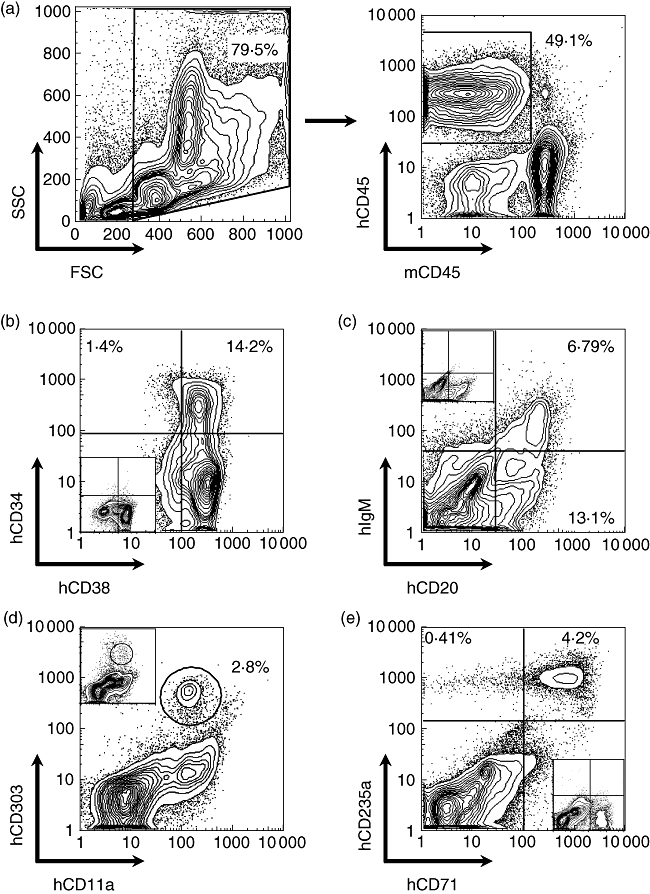
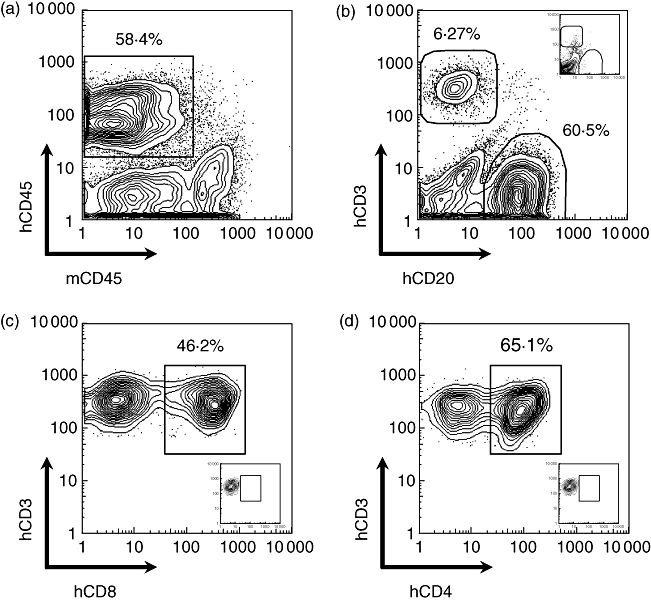
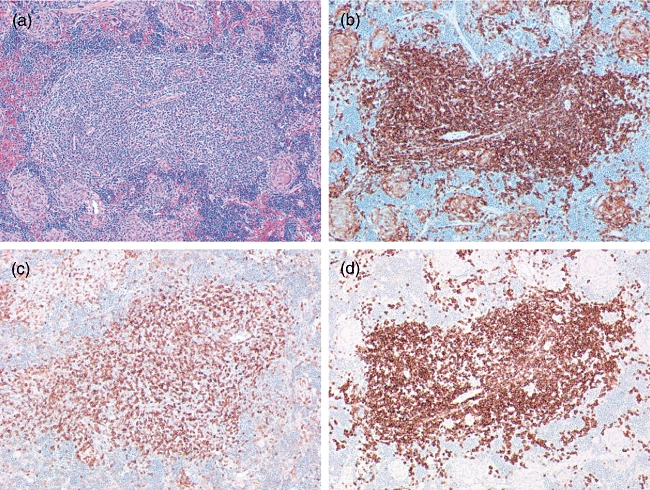
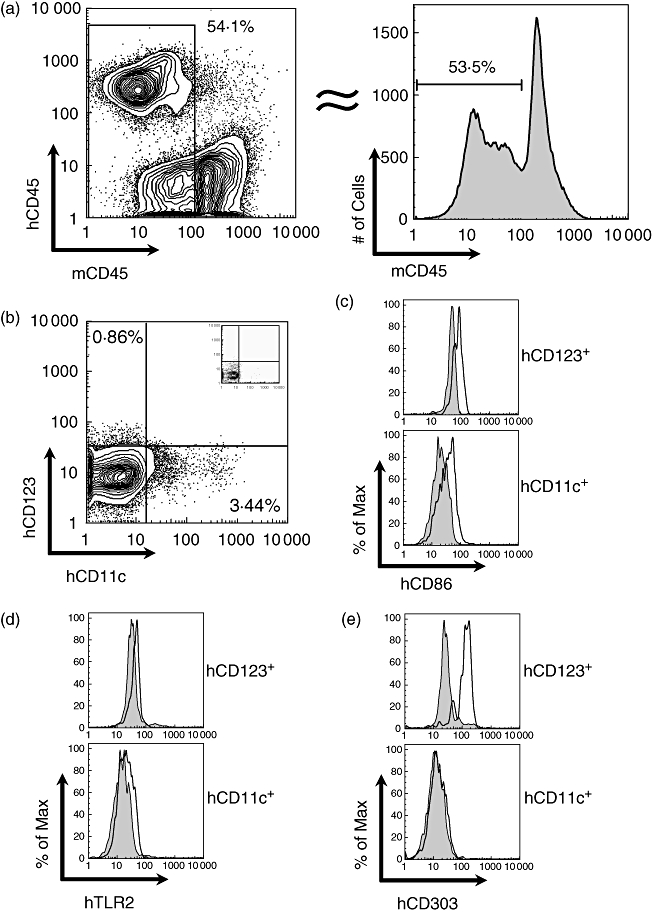
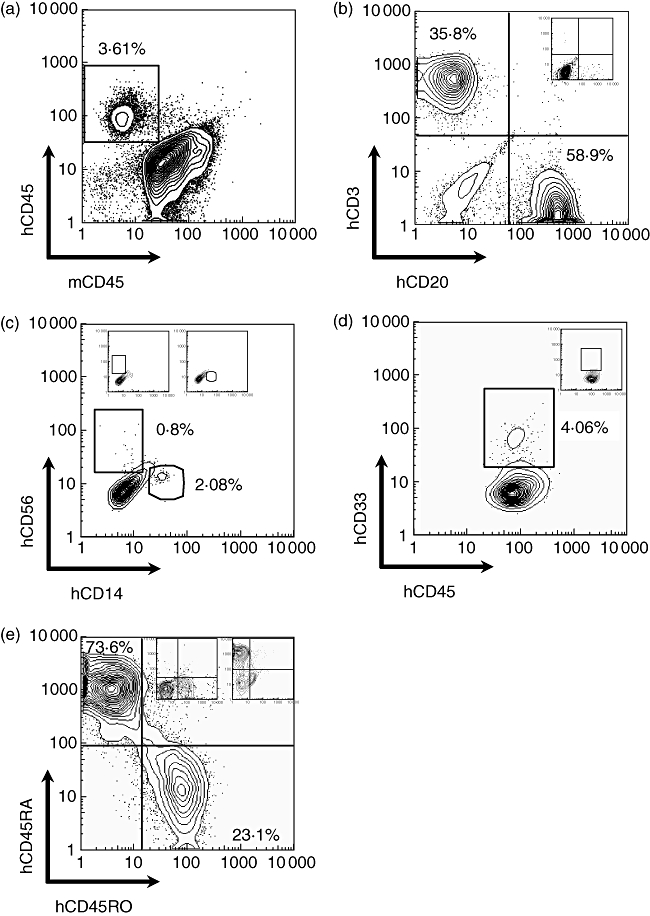
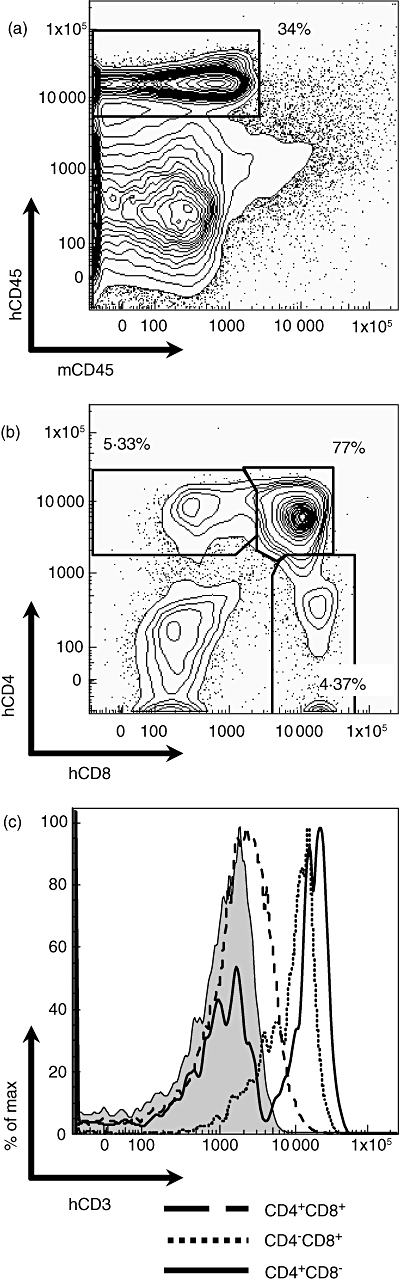
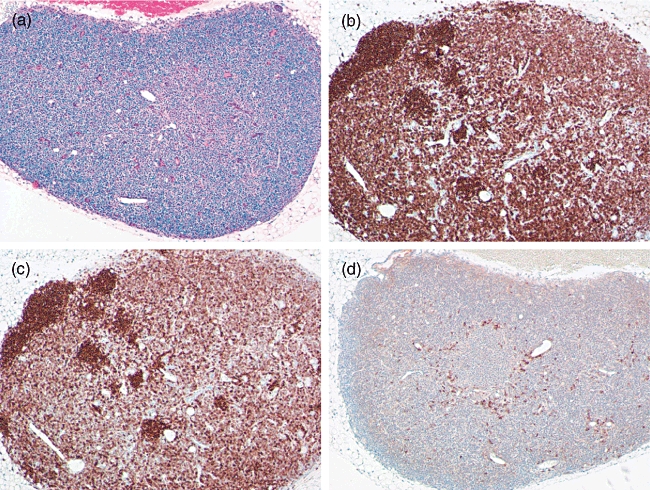
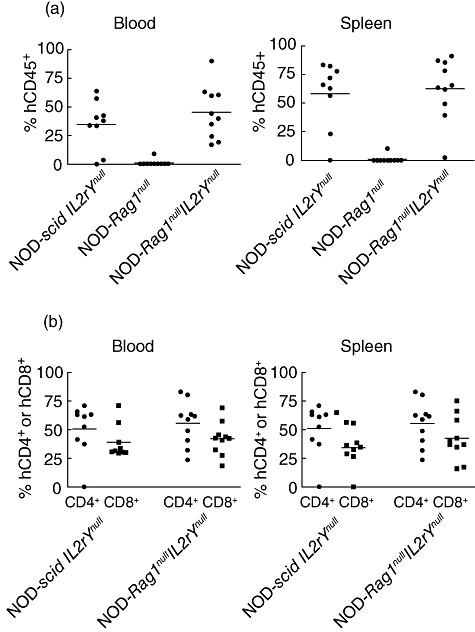
Immunodeficient hosts engrafted with human lymphohaematopoietic cells hold great promise as a preclinical bridge for understanding human haematopoiesis and immunity. We now describe a new immunodeficient radioresistant non-obese diabetic mice (NOD) stock based on targeted mutations in the recombination activating gene-1 (Rag1(null)) and interleukin (IL)-2 receptor common gamma chain (IL2rgamma(null)), and compare its ability to support lymphohaematopoietic cell engraftment with that achieved in radiosensitive NOD.CB17-Prkdc(scid) (NOD-Prkdc(scid)) IL2rgamma(null) mice. We observed that immunodeficient NOD-Rag1(null) IL2rgamma(null) mice tolerated much higher levels of irradiation conditioning than did NOD-Prkdc(scid) IL2rgamma(null) mice. High levels of human cord blood stem cell engraftment were observed in both stocks of irradiation-conditioned adult mice, leading to multi-lineage haematopoietic cell populations and a complete repertoire of human immune cells, including human T cells. Human peripheral blood mononuclear cells also engrafted at high levels in unconditioned adult mice of each stock. These data document that Rag1(null) and scid stocks of immunodeficient NOD mice harbouring the IL2rgamma(null) mutation support similar levels of human lymphohaematopoietic cell engraftment. NOD-Rag1(null) IL2rgamma(null) mice will be an important new model for human lymphohaematopoietic cell engraftment studies that require radioresistant hosts.


Figures

Fig. 1
Fig. 1
Characterization of non-obese diabetic (NOD)–recombination activating gene-1 (Rag1null) interleukin (IL)-2 receptor common gamma chain (IL2r γnull) null mice. (a) Cohorts of NOD–Rag1null IL2rγnull mice were treated with varying doses of whole body irradiation and their survival determined. (b) Histology from non-engrafted NOD–Rag1null IL2rγnull mice; spleen (left panel) and thymus (right panel) (haematoxylin and eosin staining; 200×).
Fig. 2
Fig. 2
Flow cytometric analysis of human lymphohaematopoietic engraftment in bone marrow of non-obese diabetic (NOD)–recombination activating gene-1 (Rag1null) interleukin (IL)-2 receptor common gamma chain (IL2r γnull) null mice 12 weeks after haematopoietic stem cells (HSC) injection. NOD–Rag1null IL2r γnull mice were irradiated with 550 cGy and engrafted with T cell-depleted umbilical cord blood (UCB) containing 3 × 10⁴ CD34+ stem cells. Twelve weeks later, their bone marrow was analysed by flow cytometry for the presence of human lymphohaematopoietic cells. Shown are representative contour plots. (a) Gating paradigm used for all engraftment data that are shown in Tables 2 and 3. A viable cell gate based on forward-scatter (FSC) and side-scatter (SSC) of all events collected (left panel). Contour plots showing viable cells positive for human CD45 and negative for mouse CD45 (gate in right panel). (b–e) Representative histograms of human CD45+ cells labelled with lineage-specific antibodies. Insets show isotype staining contour plots. All plots are 5% contour intervals plus outliers. Percentages indicated in (b) to (d) are of the hCD45+ cells; (e) is gated on total mCD45 negative cells.
Fig. 3
Fig. 3
Flow cytometric analysis of human lymphohaematopoietic engraftment in spleen of non-obese diabetic (NOD)–recombination activating gene-1 (Rag1null) interleukin (IL)-2 receptor common gamma chain (IL2r γnull) null mice 12 weeks after haematopoietic stem cells (HSC) injection. NOD–Rag1null IL2r γnull mice were irradiated with 550 cGy and engrafted with T cell-depleted umbilical cord blood (UCB) containing 3 × 10⁴ CD34+ stem cells. Twelve weeks later, their spleens were analysed by flow cytometry for the presence of human lymphohaematopoietic cells. Shown are representative contour plots. (a) Contour plots showing viable cells positive for human CD45 and negative for mouse CD45 (gate). (b–d) Representative histograms of human CD45+ cells labelled with lineage-specific antibodies. Insets show isotype staining contour plots. All plots are 5% contour intervals plus outliers. Percentages indicated in (b) are of the hCD45+ cells; (c,d) are gated on human CD3+ cells and the percentages indicated are the CD4+ or CD8+ staining of the total human CD3+ population.
Fig. 4
Fig. 4
Immunohistochemical analysis of spleen of non-obese diabetic (NOD)–recombination activating gene-1 (Rag1null) interleukin (IL)-2 receptor common gamma chain (IL2r γnull) null mice 12 weeks after haematopoietic stem cells (HSC) injection. NOD–Rag1null IL2rγnull mice were irradiated with 550cGy, engrafted with T cell-depleted UCB containing 3 × 10⁴ CD34+ stem cells, and analysed 12 weeks after engraftment. Shown are spleen sections stained with haematoxylin and eosin (a), anti-human CD45 (b), anti-human CD3 monoclonal antibody (mAb) (c) and anti-human CD20 mAb (d); 100×.
Fig. 5
Fig. 5
Flow cytometric analysis of human dendritic cells in the spleen of non-obese diabetic (NOD)–recombination activating gene-1 (Rag1null) interleukin (IL)-2 receptor common gamma chain (IL2r γnull) null mice 12 weeks after haematopoietic stem cells (HSC) injection. NOD–Rag1nullIL2r γnull mice were irradiated with 550 cGy and engrafted with T cell-depleted umbilical cord blood (UCB) containing 3 × 10⁴ CD34+ stem cells. Twelve weeks later, their spleens were analysed by flow cytometry for the presence of human dendritic cells. Shown are representative histograms and contour plots. (a) Contour plot showing viable cells negative for mouse CD45 (gate). (b) Representative contour plot of human cells based on lack of expression of mouse CD45 labeled with anti-human specific dendritic cell antibodies. Contour plot is 5% contour intervals plus outliers. (c–e) Representative histograms of cell surface phenotype of human CD123+ (top panels) and human CD11c+ (bottom panels) cells for human Toll-like receptor-2 (TLR-2) (c), human CD86 (d) and human CD303 (BDCA2) (e). Shaded histogram indicates isotype control staining. Data in (c) to (e) are presented as relative cell number (‘% of max’).
Fig. 6
Fig. 6
Flow cytometric analysis of human lymphohematopoietic engraftment in blood of non-obese diabetic (NOD)–recombination activating gene-1 (Rag1null) interleukin (IL)-2 receptor common gamma chain (IL2r γnull) null mice 12 weeks after haematopoietic stem cells (HSC) injection. NOD–Rag1null IL2r γnull mice were irradiated with 550 cGy and engrafted with T cell-depleted umbilical cord blood (UCB) containing 3 × 10⁴ CD34+ stem cells. Twelve weeks later, their peripheral blood was analysed by flow cytometry for the presence of human lymphohaematopoietic cells. Shown are representative contour plots. (a) Contour plots showing viable cells positive for human CD45 and negative for mouse CD45 (gate). (b–e) Representative histograms of human CD45+ cells labelled with lineage-specific antibodies. Insets show isotype staining contour plots. All plots are 5% contour intervals plus outliers. Percentages indicated in (b) to (d) are of the hCD45+ cells; (e) represents percentages of human CD3+ cells.
Fig. 7
Fig. 7
Flow cytometric analysis of human lymphohematopoietic engraftment in thymus of non-obese diabetic (NOD)–recombination activating gene-1 (Rag1null) interleukin (IL)-2 receptor common gamma chain (IL2r γnull) null mice 12 weeks after haematopoietic stem cells (HSC) injection. NOD–Rag1null IL2r γnull mice were irradiated with 550 cGy and engrafted with T cell-depleted umbilical cord blood (UCB) containing 3 × 10⁴ CD34+ stem cells. Twelve weeks later, their thymus was analysed by flow cytometry for the presence of human lymphohaematopoietic cells. Shown are representative histograms and contour plots. Representative flow cytometry analyses of human thymocyte development in one individual haematopoietic stem cells (HSC)-engrafted mouse. Contour plot of human CD45+ cells is shown in (a). Contour plots of human CD45+ cells labelled with human CD8 and human CD4 are shown in (b). Histogram in (c) shows human CD3 expression on cells gated as CD4+CD8+, CD4+CD8- and CD4-CD8+. All plots are 5% contour intervals plus outliers.
Fig. 8
Fig. 8
Immunohistochemical analysis of thymus of non-obese diabetic (NOD)– recombination activating gene-1 (Rag1null) interleukin (IL)-2 receptor common gamma chain (IL2r γnull) null mice 12 weeks after haematopoietic stem cells (HSC) injection. NOD–Rag1null IL2r γnull mice were irradiated with 550 cGy and engrafted with T cell-depleted umbilical cord blood (UCB) containing 3 × 10⁴ CD34+ stem cells, and analysed 12 weeks after engraftment. Shown are thymus sections stained with haematoxylin and eosin (a), anti-human CD45 (b), anti-human CD3 monoclonal antibody (mAb) (c) and anti-human CD20 mAb (d); 100×.
Fig. 9
Fig. 9
Human PBMC engraftment in immunodeficient interleukin (IL)-2 receptor common gamma chain (IL2r γnull) mice. Three indicated stocks of immunodeficient mice were injected intravenously with 20 × 106 human peripheral blood mononuclear cells (PBMC) and assessed for human cell engraftment in the blood four weeks later. (a) Percentage of human CD45+ cells in the peripheral blood (left panel) and spleen (right panel) in the indicated strains. (b) Percentage of human CD3 cells expressing hCD4 (circles) or hCD8 (squares) in the peripheral blood (left panel) and spleen (right panel). Symbols represent individual animals. Bars represent the mean percentage engraftment.

Similar articles

Cited by

References

    1. Shultz LD, Pearson T, King M, et al. Humanized NOD/ltsz-scid il2 receptor common gamma chain knockout mice in diabetes research. Ann NY Acad Sci. 2007;1103:77–89. - PubMed
    1. Shultz LD, Ishikawa F, Greiner DL. Humanized mice in translational biomedical research. Nat Rev. 2007;7:118–30. - PubMed
    1. Legrand N, Weijer K, Spits H. Experimental models to study development and function of the human immune system in vivo. J Immunol. 2006;176:2053–8. - PubMed
    1. Bernard D, Peakman M, Hayday AC. Establishing humanized mice using stem cells: maximizing the potential. Clin Exp Immunol. 2008;152:406–14. - PMC - PubMed
    1. Bosma GC, Custer RP, Bosma MJ. A severe combined immunodeficiency mutation in the mouse. Nature. 1983;301:527–30. - PubMed

Publication types

MeSH terms

Substances