. 2008 Sep 11;3(3):327-39.
doi: 10.1016/j.stem.2008.07.002.

Molecular analysis of stem cells and their descendants during cell turnover and regeneration in the planarian Schmidtea mediterranea

Affiliations

Molecular analysis of stem cells and their descendants during cell turnover and regeneration in the planarian Schmidtea mediterranea

George T Eisenhoffer et al. Cell Stem Cell. .

Abstract

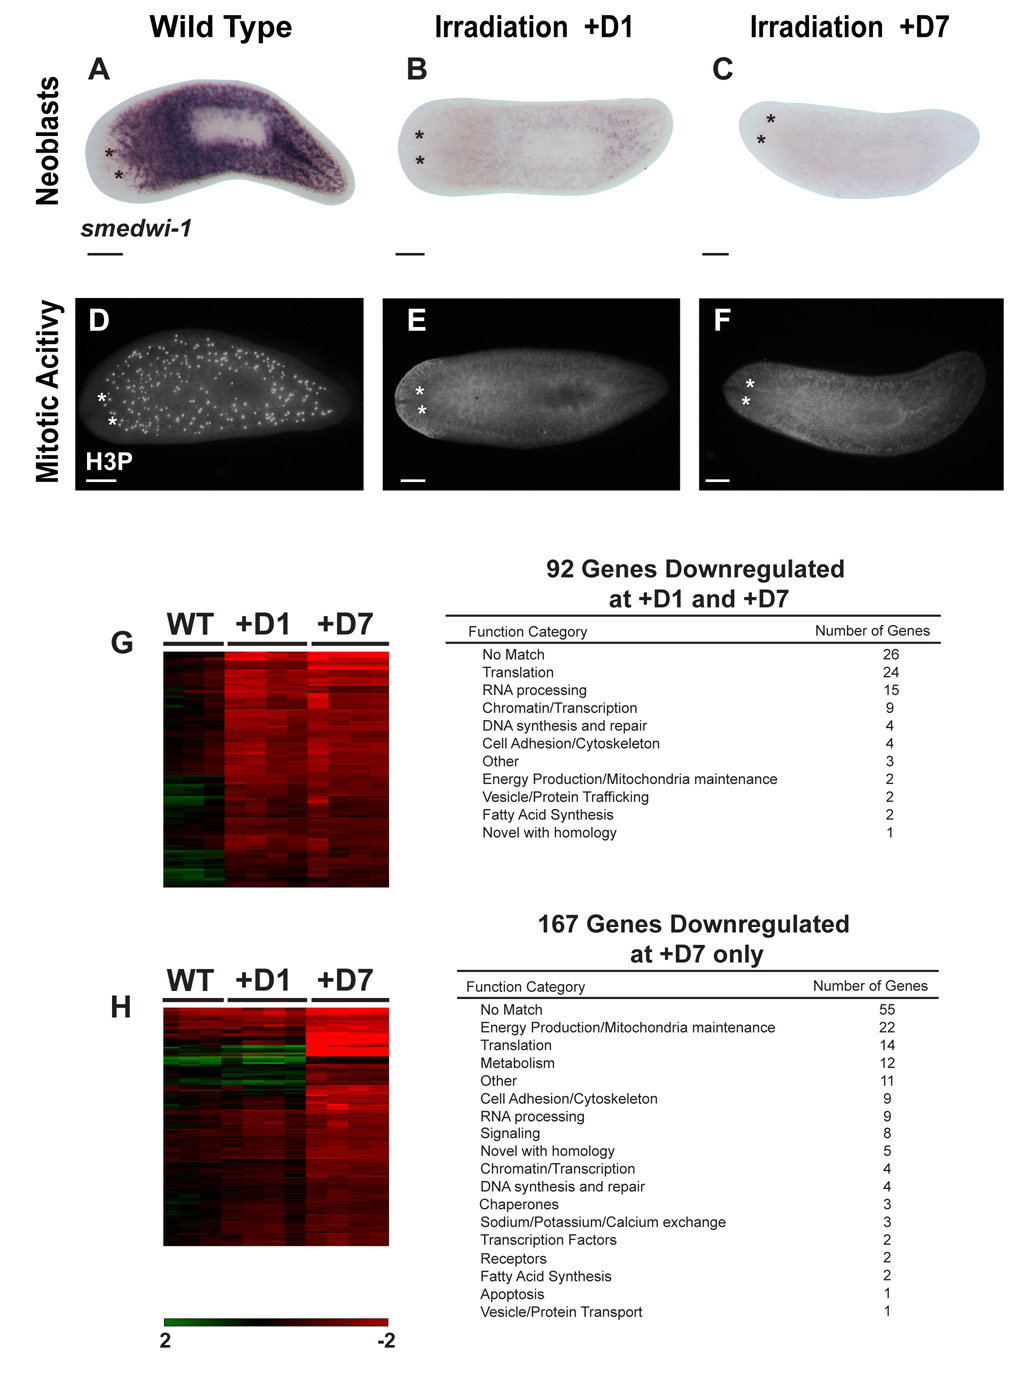
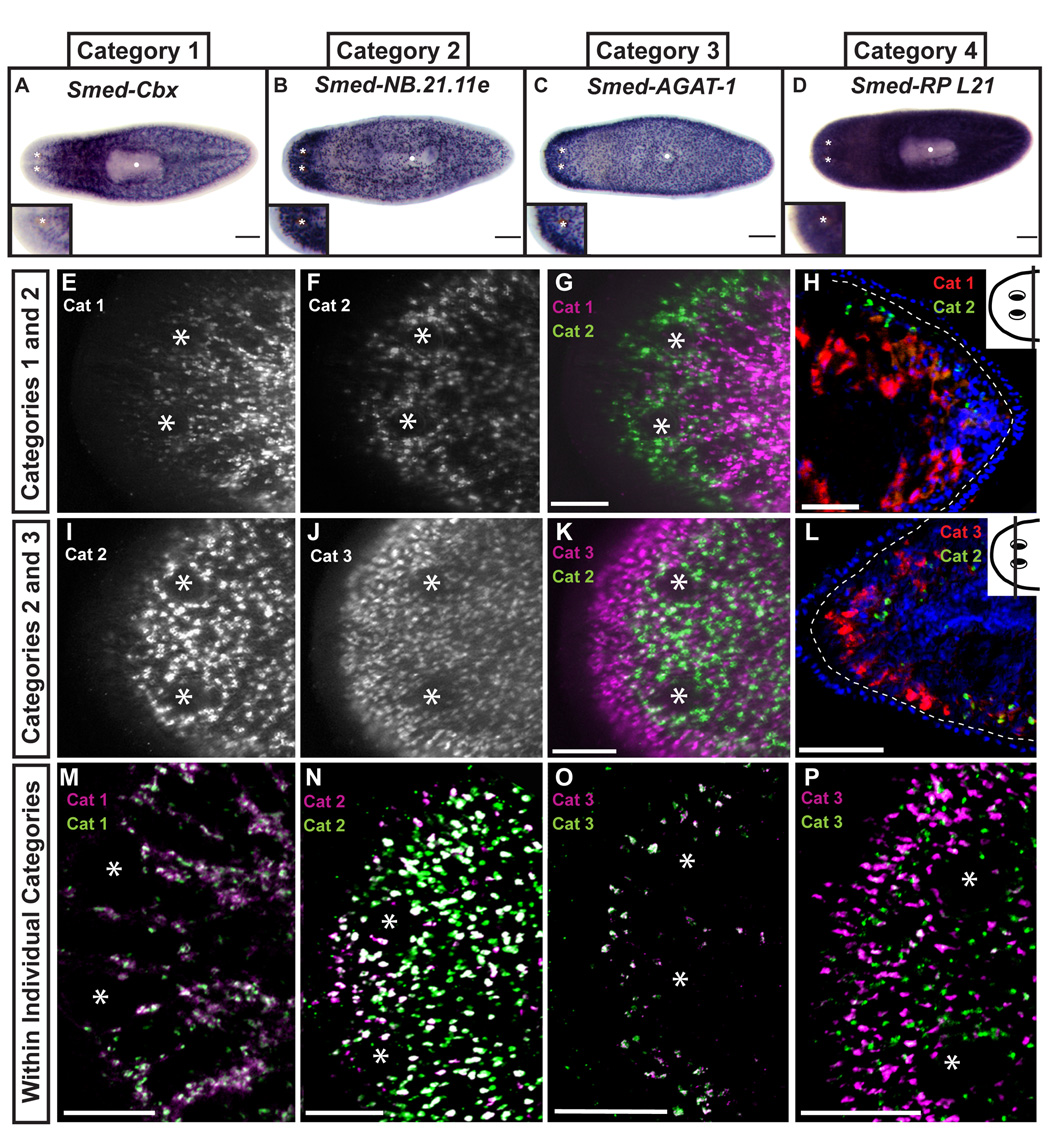
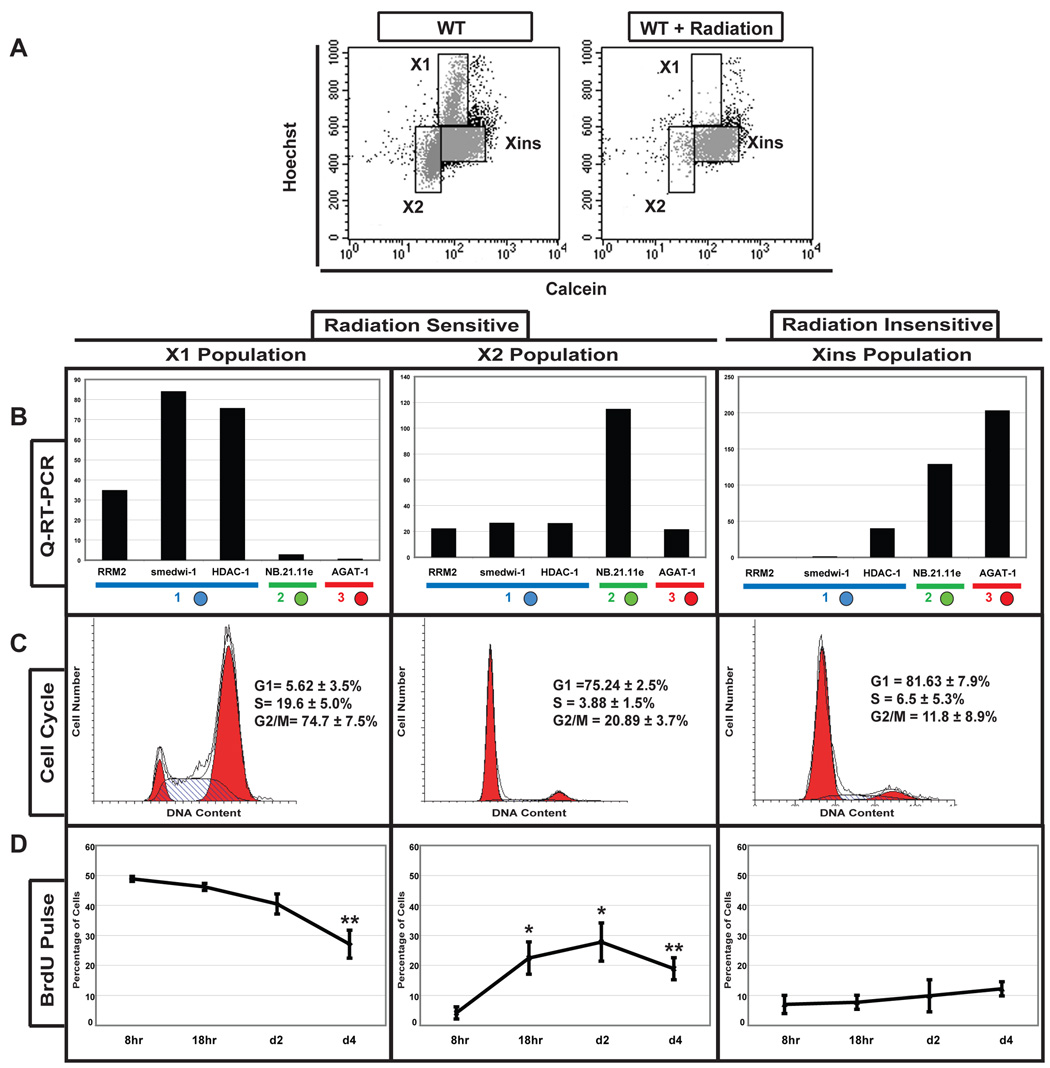
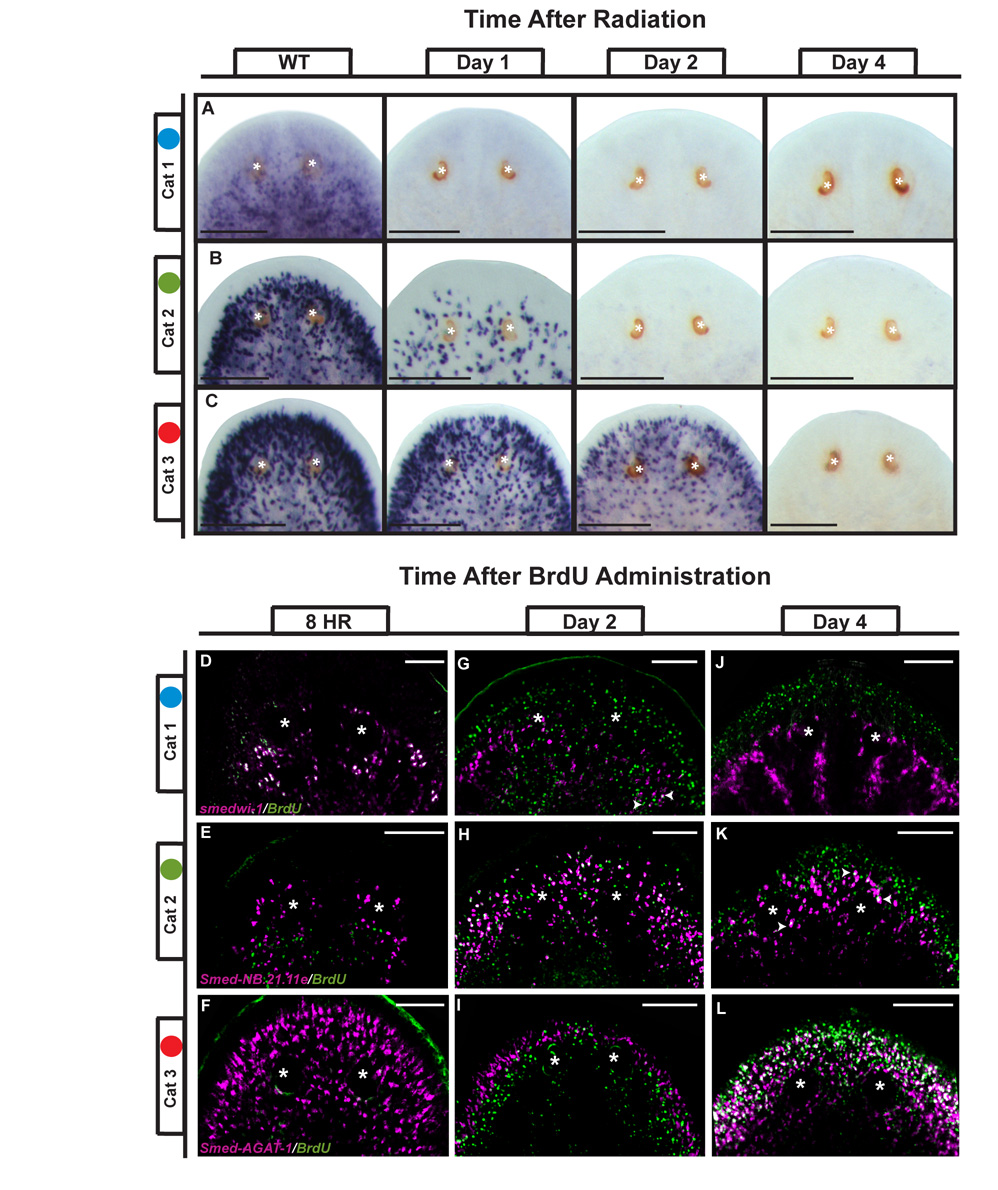
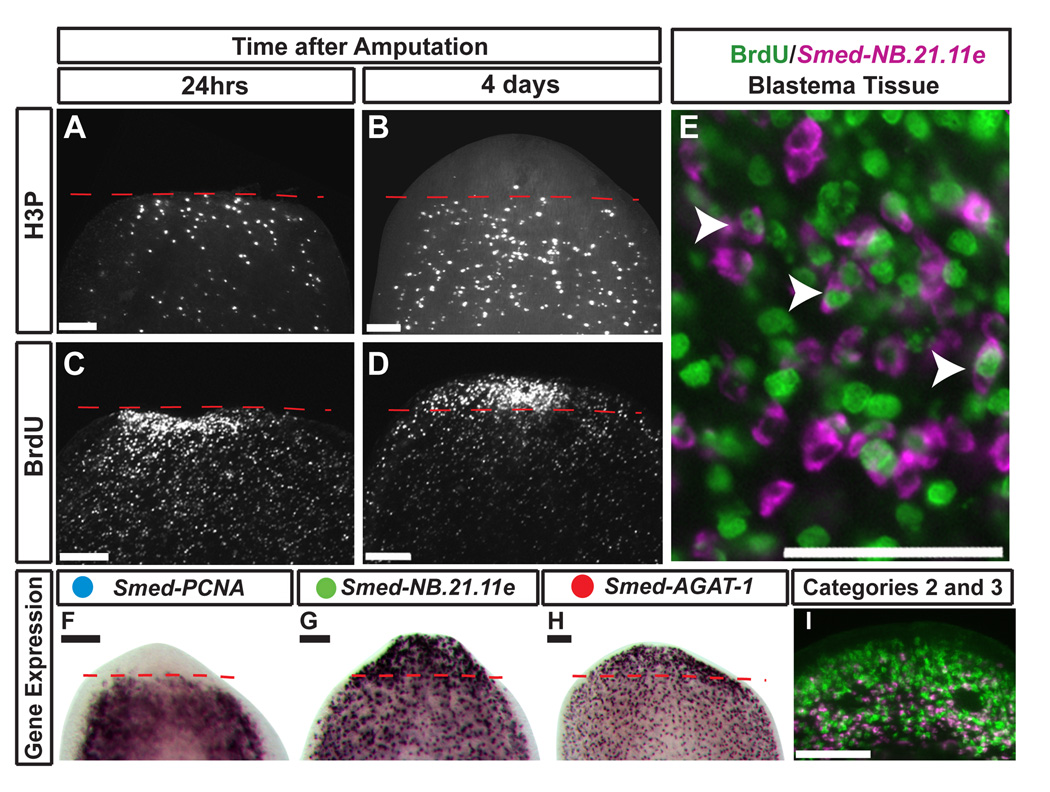
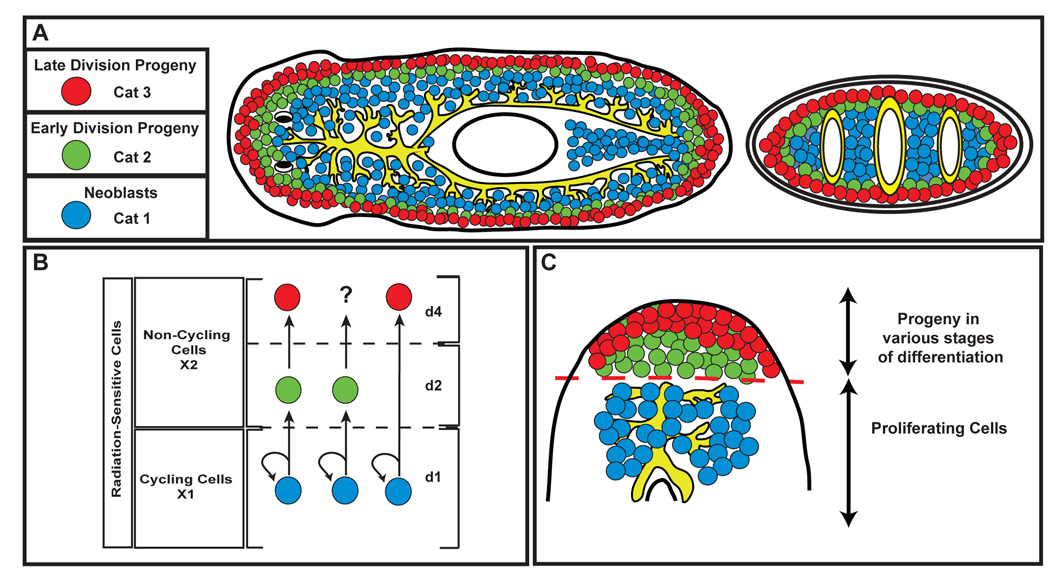
In adult planarians, the replacement of cells lost to physiological turnover or injury is sustained by the proliferation and differentiation of stem cells known as neoblasts. Neoblast lineage relationships and the molecular changes that take place during differentiation into the appropriate cell types are poorly understood. Here we report the identification and characterization of a cohort of genes specifically expressed in neoblasts and their descendants. We find that genes with severely downregulated expression after irradiation molecularly define at least three discrete subpopulations of cells. Simultaneous BrdU labeling and in situ hybridization experiments in intact and regenerating animals indicate that these cell subpopulations are related by lineage. Our data demonstrate not only the ability to measure and study the in vivo population dynamics of adult stem cells during tissue homeostasis and regeneration, but also the utility of studies in planarians to broadly inform stem cell biology in adult organisms.


Figures

Figure 1
Figure 1. Identification of genes affected by irradiation
smedwi-1 in situ hybridizations in (A) wild-type, (B) 24hrs, and (C) 7 day post-irradiated animals. Antiphosphohistone H3 (H3P) immunostaining in (D) wild-type, (E) 24hrs and (F) 7 day post-irradiated animals. (G–H) Hierarchical clustering of genes downregulated by irradiation (WT n=3; +D1, +D7 n=4) (see text for details). Heat map signal values range from 2 to −2, Log Base 2. (G) ESTs permanently downregulated 24 hours post-irradiation (n=92). (H) ESTs not affected 24 hours after irradiation, but significantly downregulated 7 days post-irradiation (n=167) (150 shown). Number of unique genes and corresponding Gene Ontology Function Category are shown. Scale bars (A–F): 200µm. Day 1: +D1; Day 7: +D7.
Figure 2
Figure 2. Spatial distribution defines gene expression categories in the whole animal
Thirty genes were screened by whole-mount in situ hybridization yielding four distinct gene expression patterns (see S3). Representative results shown in A–D. Insets indicate left anterior region of each animal, an area normally devoid of dividing cells. Anterior is to the left. Asterisks mark photoreceptors. White dot marks pharynx in A–D. (E–P) Single confocal sections of double fluorescent in situ hybridizations. (E–H) Category 1 (Smed-piwi-1) and 2 (Smed-NB.21.11e). (I–L) Category 2 (Smed-NB.21.11e) and 3 (Smed-AGAT-1). (H and L) Single slice confocal images of 10µm thick transverse sections counterstained with Hoechst. Dotted line demarcates basement membrane, dorsal is up. Insets mark amputation plane in whole animal. (M) Category 1 genes Smed-piwi-1 (green) and Smed-Cbx-1 (magenta); (N) Category 2 genes Smed-NB.21.11e (green) and Smed-NB.32.1g (magenta); (O) Category 3 genes Smed-AGAT-1 (green) and Smed-Ras-related (magenta); (P) Category 3 genes Smed-MCP-1 (green) and Smed-AGAT-1 (magenta). Scale Bars in A–D: 200µm; E–G, I–K: 100µm; H and L: 50 µm; M–P: 200µm.
Figure 3
Figure 3. Molecular Analyses of FACS-purified irradiation-sensitive cells
(A) Wild type (WT) and irradiated planarian (+D7) flow cytometry (Hoechst/Calcein). Populations X1 and X2 disappear after irradiation. Xins designates the irradiation insensitive population. (B) Quantitative RT-PCR of X1, X2 and Xins cells. Blue, green, and red circles represent Category 1, 2, and 3 genes, respectively. Gene expression levels are relative to the ubiquitously expressed GAPDH. (C) Flow cytometric cell cycle profile of sorted X1, X2 and Xins populations stained with propidium iodide. Percentages of cells within each phase of the cell cycle are shown (n=6). (D) BrdU incorporation into X1, X2 and Xins populations at defined times after BrdU administration by feeding. Error bars are SEM. Student’s t-test was used for statistical comparisons to 8hr time point (*p<0.03, **p<0.01).
Figure 4
Figure 4. Changes in gene expression at defined spatial and temporal boundaries during tissue homeostasis
Anterior portion of the animal is shown. (A–C) Genes from Categories 1 (Smed-Cbx-1), 2 (Smed-NB.21.11e), and 3 (Smed-AGAT-1) disappear at different rates after exposure to irradiation as visualized by whole-mount in situ hybridization. (D–L) Single pulse of BrdU delivered by feeding combined with in situ hybridization of Categories 1, 2 and 3 genes as indicated. Single slice confocal images with gene expression in red and BrdU staining in green at 8 hours (D–F), 2 days (G–I), and 4 days (J–L). Arrowheads indicate double positive cells. Asterisks mark the photoreceptors. Scale Bars in A–C: 200µm; D–L: 100µm.
Figure 5
Figure 5. Lineage determination and population dynamics during anterior regeneration
(A–G) Anterior blastemas of trunk fragments after amputation. Red dashed line marks amputation plane. Anti-phosphohistone H3 (H3P) immunostaining at 1 (A) and 4 days (B) after amputation. Injection of a single pulse of BrdU followed by amputation 18 hours later, and fixed at 1 (C) and 4 days (D) after amputation. (E) Single confocal slice image of simultaneously labeled BrdU nuclei (green) and Smed-NB.21.11e positive cells (magenta) in the blastema. Arrowheads show coincident staining. (F–I) Gene expression for Smed-PCNA (F), Smed-NB.21.11e (G), Smed-AGAT-1 (H), and Smed-NB.21.11e (magenta) and Smed-AGAT-1 (green) (I) in regeneration blastemas 4 days post-amputation. Image in (I) is a single confocal slice of only the regeneration blastema. Scale Bars in A–D, F–I: 100µm; E: 50 µm.
Figure 6
Figure 6. Planarian ASCs and their descendents
(A) Distribution of expression patterns observed for Category 1, 2, and 3 genes. Representative genes for each category are listed. (B) Lineage determination in planarian ASCs. Three different scenarios for changes in gene expression during migration are depicted. (C) Population dynamics of ASCs and descendents during regeneration. Proliferating ASCs are restricted to the area below the amputation plane, and give rise to descendents which migrate into the blastema tissue and differentiate into the appropriate cell types. Dashed red line: amputation plane.

Similar articles

Cited by

References

    1. Anderson DJ, Gage FH, Weissman IL. Can stem cells cross lineage boundaries? Nature medicine. 2001;7:393–395. - PubMed
    1. Baguña J. Mitosis in the intact and regenerating planarian Dugesia mediterranea I. Mitotic studies during growth, feeding, and starvation. J Exp Zool. 1976;195:53–64.
    1. Bardeen CR, Baetjer FH. The inhibitive action of the Roentgen rays on regeneration in planarians. J Exp Zool. 1904;1:191–195.
    1. Blanpain C, Horsley V, Fuchs E. Epithelial stem cells: turning over new leaves. Cell. 2007;128:445–458. - PMC - PubMed
    1. Blanpain C, Lowry WE, Geoghegan A, Polak L, Fuchs E. Self-renewal, multipotency, and the existence of two cell populations within an epithelial stem cell niche. Cell. 2004;118:635–648. - PubMed

Publication types