

The proton-translocating a subunit of F0F1-ATP synthase is allocated asymmetrically to the peripheral stalk
- PMID: 18786919
- PMCID: PMC2662277
- DOI: 10.1074/jbc.M805170200
The proton-translocating a subunit of F0F1-ATP synthase is allocated asymmetrically to the peripheral stalk
Abstract
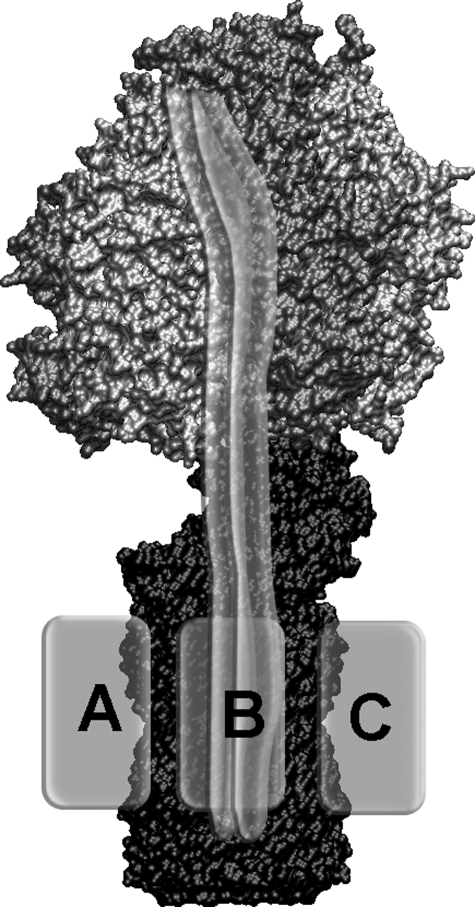
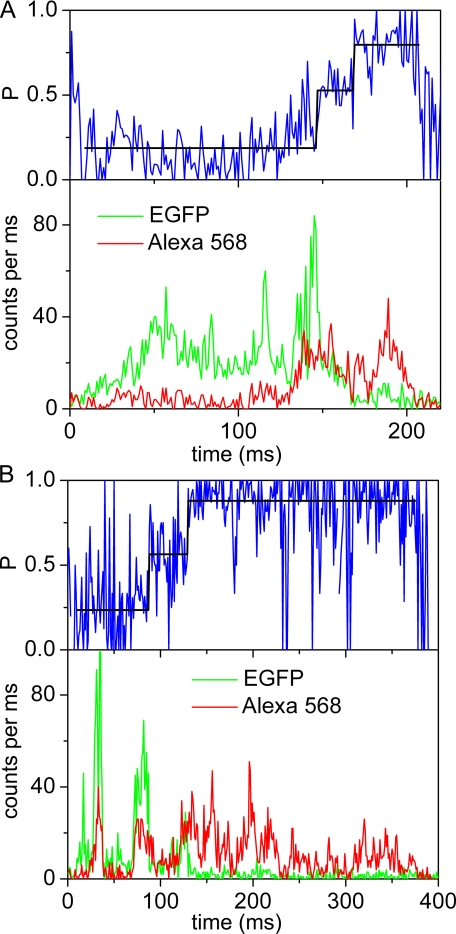
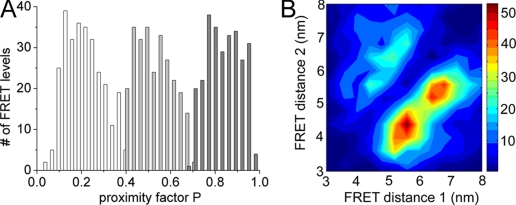
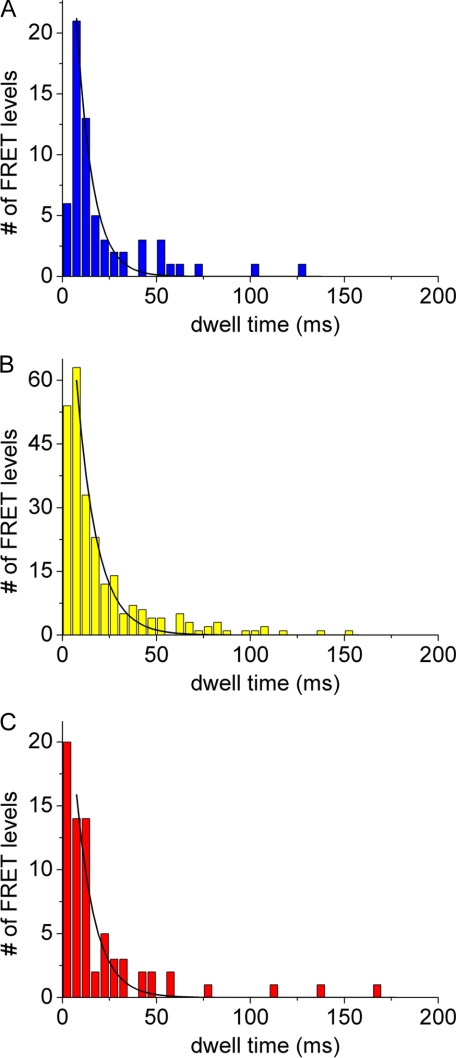
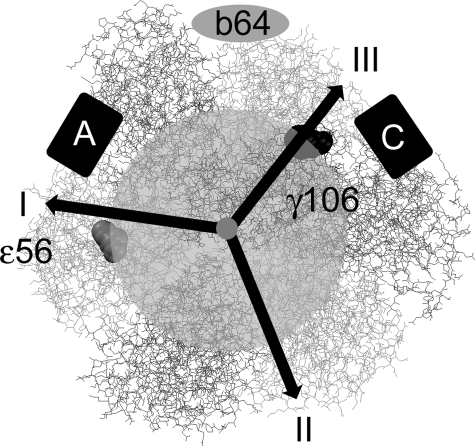
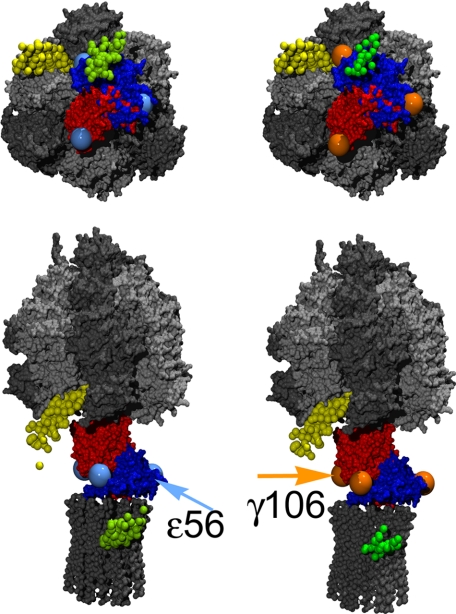
The position of the a subunit of the membrane-integral F0 sector of Escherichia coli ATP synthase was investigated by single molecule fluorescence resonance energy transfer studies utilizing a fusion of enhanced green fluorescent protein to the C terminus of the a subunit and fluorescent labels attached to specific positions of the epsilon or gamma subunits. Three fluorescence resonance energy transfer levels were observed during rotation driven by ATP hydrolysis corresponding to the three resting positions of the rotor subunits, gamma or epsilon, relative to the a subunit of the stator. Comparison of these positions of the rotor sites with those previously determined relative to the b subunit dimer indicates the position of a as adjacent to the b dimer on its counterclockwise side when the enzyme is viewed from the cytoplasm. This relationship provides stability to the membrane interface between a and b2, allowing it to withstand the torque imparted by the rotor during ATP synthesis as well as ATP hydrolysis.
Figures
Similar articles
-
Both rotor and stator subunits are necessary for efficient binding of F1 to F0 in functionally assembled Escherichia coli ATP synthase.J Biol Chem. 2005 Sep 30;280(39):33338-45. doi: 10.1074/jbc.M506251200. Epub 2005 Aug 5. J Biol Chem. 2005. PMID: 16085645
-
Movements of the epsilon-subunit during catalysis and activation in single membrane-bound H(+)-ATP synthase.EMBO J. 2005 Jun 15;24(12):2053-63. doi: 10.1038/sj.emboj.7600682. Epub 2005 May 26. EMBO J. 2005. PMID: 15920483 Free PMC article.
-
Rotor/Stator interactions of the epsilon subunit in Escherichia coli ATP synthase and implications for enzyme regulation.J Biol Chem. 2004 Aug 20;279(34):35616-21. doi: 10.1074/jbc.M405012200. Epub 2004 Jun 15. J Biol Chem. 2004. PMID: 15199054
-
Subunit movements in membrane-integrated EF0F1 during ATP synthesis detected by single-molecule spectroscopy.Biochim Biophys Acta. 2006 May-Jun;1757(5-6):311-9. doi: 10.1016/j.bbabio.2006.03.020. Epub 2006 Apr 24. Biochim Biophys Acta. 2006. PMID: 16765907 Review.
-
The regulatory subunit ε in Escherichia coli FOF1-ATP synthase.Biochim Biophys Acta Bioenerg. 2018 Sep;1859(9):775-788. doi: 10.1016/j.bbabio.2018.06.013. Epub 2018 Jun 20. Biochim Biophys Acta Bioenerg. 2018. PMID: 29932911 Free PMC article. Review.
Cited by
-
Solution structure, determined by nuclear magnetic resonance, of the b30-82 domain of subunit b of Escherichia coli F1Fo ATP synthase.J Bacteriol. 2009 Dec;191(24):7538-44. doi: 10.1128/JB.00540-09. Epub 2009 Oct 9. J Bacteriol. 2009. PMID: 19820091 Free PMC article.
-
Dynamic ligand-induced conformational rearrangements in P-glycoprotein as probed by fluorescence resonance energy transfer spectroscopy.J Biol Chem. 2012 Jan 6;287(2):1112-27. doi: 10.1074/jbc.M111.301192. Epub 2011 Nov 15. J Biol Chem. 2012. PMID: 22086917 Free PMC article.
-
36 degrees step size of proton-driven c-ring rotation in FoF1-ATP synthase.EMBO J. 2009 Sep 16;28(18):2689-96. doi: 10.1038/emboj.2009.213. Epub 2009 Jul 30. EMBO J. 2009. PMID: 19644443 Free PMC article.
-
Molecular dynamics simulations of the rotary motor F(0) under external electric fields across the membrane.Biophys J. 2010 Mar 17;98(6):1009-17. doi: 10.1016/j.bpj.2009.11.025. Biophys J. 2010. PMID: 20303858 Free PMC article.
-
FRET-based dynamic structural biology: Challenges, perspectives and an appeal for open-science practices.Elife. 2021 Mar 29;10:e60416. doi: 10.7554/eLife.60416. Elife. 2021. PMID: 33779550 Free PMC article. Review.
References
-
- Boyer, P. D. (1997) Annu. Rev. Biochem. 66 717-749 - PubMed
-
- Weber, J., and Senior, A. E. (1997) Biochim. Biophys. Acta 1319 19-58 - PubMed
-
- Bottcher, B., Bertsche, I., Reuter, R., and Graber, P. (2000) J. Mol. Biol. 296 449-457 - PubMed
-
- Meier, T., Polzer, P., Diederichs, K., Welte, W., and Dimroth, P. (2005) Science 308 659-662 - PubMed
Publication types
MeSH terms
Substances
LinkOut - more resources
Full Text Sources
Molecular Biology Databases
