. 2008 Nov;82(22):11331-43.
doi: 10.1128/JVI.00577-08. Epub 2008 Sep 10.

Expression of nonstructural rotavirus protein NSP4 mimics Ca2+ homeostasis changes induced by rotavirus infection in cultured cells

Affiliations

Expression of nonstructural rotavirus protein NSP4 mimics Ca2+ homeostasis changes induced by rotavirus infection in cultured cells

Yuleima Díaz et al. J Virol. 2008 Nov.

Abstract

Rotavirus infection modifies Ca(2+) homeostasis, provoking an increase in Ca(2+) permeation, the cytoplasmic Ca(2+) concentration ([Ca(2+)](cyto)), and total Ca(2+) pools and a decrease in Ca(2+) response to agonists. A glycosylated viral protein(s), NSP4 and/or VP7, may be responsible for these effects. HT29 or Cos-7 cells were infected by the SA11 clone 28 strain, in which VP7 is not glycosylated, or transiently transfected with plasmids coding for NSP4-enhanced green fluorescent protein (EGFP) or NSP4. The permeability of the plasma membrane to Ca(2+) and the amount of Ca(2+) sequestered in the endoplasmic reticulum released by carbachol or ATP were measured in fura-2-loaded cells at the single-cell level under a fluorescence microscope or in cell suspensions in a fluorimeter. Total cell Ca(2+) pools were evaluated as (45)Ca(2+) uptake. Infection with SA11 clone 28 induced an increase in Ca(2+) permeability and (45)Ca(2+) uptake similar to that found with the normally glycosylated SA11 strain. These effects were inhibited by tunicamycin, indicating that inhibition of glycosylation of a viral protein other than VP7 affects the changes of Ca(2+) homeostasis induced by infection. Expression of NSP4-EGFP or NSP4 in transfected cells induced the same changes observed with rotavirus infection, whereas the expression of EGFP or EGFP-VP4 showed the behavior of uninfected and untransfected cells. Increased (45)Ca(2+) uptake was also observed in cells expressing NSP4-EGFP or NSP4, as evidenced in rotavirus infection. These results indicate that glycosylated NSP4 is primarily responsible for altering the Ca(2+) homeostasis of infected cells through an initial increase of cell membrane permeability to Ca(2+).


Figures
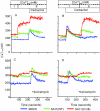
FIG. 1.
FIG. 1.
Effects of rotavirus infection with the WT and variant clone 28 (Cl 28) SA11 strains on [Ca2+]cyto, plasma membrane permeability to Ca2+, and agonist-releasable Ca2+ pools in HT29 cells. Confluent monolayers of HT29 cells grown in 75-cm2 Falcon flasks were infected with the WT or the variant clone 28 of SA11 rotavirus. A mock-infected flask was kept as a control. At 1 h postinfection the inoculum was removed and replaced by fresh medium (A and B) or medium containing 5 μg/ml tunicamycin (C and D). At 6 h postinfection, the monolayers were trypsinized, and the cell suspensions were loaded with fura-2 for measurement of the [Ca2+]cyto in a fluorimeter cuvette. Under all conditions (with [+] or without tunicamycin treatment), membrane permeability to Ca2+ was evaluated by the change in [Ca2+]cyto induced by the step change of extracellular Ca2+ concentration from 1 to 6 mM ([Ca2+]out). The state of filling of agonist-sensitive sequestered Ca2+ pools was evaluated by the addition of 10 μM carbachol. The state of membrane permeability after the addition of carbachol was evaluated in panels B and D by a step change of extracellular Ca2+ concentration from 1 to 6 mM. The boxes above the panels indicate the times and lengths of changes in extracellular Ca2+ ([Ca2+]out) or addition of 10 μM carbachol during Ca2+ measurements in the fluorimeter cuvette. A representative experiment from a series of four is shown.
FIG. 2.
FIG. 2.
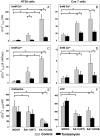
Analysis of the effects of rotavirus infection with the WT and the variant clone 28 (Cl28) SA11 strains on plasma membrane permeability to Ca2+ and agonist-releasable Ca2+ pools in HT29 and Cos-7 cells. (A, C, and E) A quantitative study of experiments in HT29 cells performed as for Fig. 1. (B, D, and F) A similar type of experiment in Cos-7 cells. (A and B) The data represent the variation of [Ca2+]cyto induced by the addition of 5 mM Ca2+ to the extracellular medium in cells infected or not by the two variants of SA11 in the presence or absence of tunicamycin (protocol as in Fig. 1A and C). (C and D) The bars correspond to the initial rate of [Ca2+]cyto change (d[Ca2+]/dt) induced by the addition of 5 mM CaCl2 to the extracellular medium (protocol as in Fig. 1A and C). (E and F) The data correspond to the variation of [Ca2+]cyto induced by the addition of 10 μM carbachol to HT29 cells (protocol as in Fig. 1B and D) or 250 μM ATP to Cos-7 cells. The bars correspond to the means plus SEM of four sets of independent experiments in each series (*, P < 0.01; paired t test).
FIG. 3.
FIG. 3.
Effects of infection with the WT and the variant clone 28 (Cl 28) SA11 strains on 45Ca2+ uptake. Intracellular Ca2+ pools were evaluated by 45Ca2+ uptake in rotavirus (SA11 WT or SA11 Cl 28) or mock-infected cells in the presence or absence of tunicamycin. Confluent monolayers of Cos-7 cells in 24-well plates were mock or rotavirus infected. Tunicamycin (5 μg/ml), when present, was added at 1 h postinfection, and 45Ca2+ uptake measurements were performed for 10 min at 8 h postinfection. The counts obtained in virus-infected cells were normalized to the values obtained in mock-infected cells. The values correspond to the means (plus SEM) of 20 measurements (five experiments and four replicates for each condition; *, P < 0.001; paired t test).
FIG. 4.
FIG. 4.
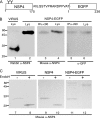
Analysis of NSP4-EGFP and NSP4 expression by immunoprecipitation and Western blotting. (A) Schematic diagram of NSP4-EGFP fusion protein. (B) Cell lysates of Cos-7 cells infected by RF rotavirus or expressing NSP4-EGFP (24 h posttransfection) were separated by SDS-PAGE and then analyzed by Western blotting using a rabbit antiserum against NSP4 (lanes 1 and 2). Lysates of Cos-7 cells expressing NSP4-EGFP were immunoprecipitated with anti-C90-NSP4 (see Materials and Methods). The lysates (Lys) and immunoprecipitated proteins were analyzed by Western blotting using mouse monoclonal antibody against NSP4 (B4-2; lanes 3 and 4) or an anti-GFP antibody (lanes 5 and 6). (C) Lysates of Cos-7 cells infected by rotavirus (lanes 7 and 8) expressing NSP4 (lanes 9 and 10) or NSP4-EGFP (lanes 11 and 12) were digested (lanes 8, 10, and 12) or not (lanes 7, 9, and 11) with endo-H, separated by SDS-PAGE, and analyzed by Western blotting using mouse monoclonal antibody against NSP4 (B4-2).
FIG. 5.
FIG. 5.
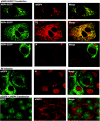
Characterization of NSP4-EGFP expression in transfected cells by confocal microscopy. Cos-7 cells were grown to 90% confluence on glass coverslips and transfected with different plasmids for the transient expression of NSP4-EGFP, NSP4, or EGFP or infected with rotavirus strain RF. In row 1 (from the top), the green fluorescence of NSP4-EGFP is colocalized with the red fluorescence of anti-NSP4 monoclonal antibody labeled by secondary antibody coupled to Cy3. In row 2, live cells expressing NSP4-EGFP are colocalized in a compartment labeled by Bodipy TR-X thapsigargin (red). Row 3 shows differential localization of NSP4-EGFP and propidium iodide (IP). Row 4 corresponds to cells infected with rotavirus strain RF (7 h postinfection). The cells were immunostained with anti-NSP4 monoclonal antibody labeled by secondary antibody coupled to fluorescein isothiocyanate and treated with propidium iodide (IP). In row 5, cells were cotransfected with separate plasmids encoding NSP4 and EGFP. NSP4 was revealed with anti-NSP4 monoclonal antibody labeled by secondary antibody coupled to Cy3. Green fluorescence corresponding to EGFP was directed to the nucleus.
FIG. 6.
FIG. 6.
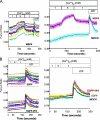
Changes in the fura-2 ratio as an indication of [Ca2+]cyto induced by NSP4-EGFP expression and rotavirus infection in Cos-7 cells. Cos-7 cells grown on glass coverslips were infected with the RF strain or transfected with the pEGFP-N1NSP4 plasmid as described in Materials and Methods. The mock condition refers to uninfected or untransfected monolayers treated with Lipofectamine 2000. At 7 h postinfection or 24 h posttransfection, the cells were loaded with fura-2-AM, and the coverslips were mounted in a flowthrough perfusion microscope chamber in an inverted fluorescence microscope for fura-2 fluorescence measurements. In the upper right panel, the NSP4-EGFP fluorescence of transfected cells shows a diffuse (D) or punctate (P) pattern. Fura-2 fluorescence measurements were performed in cells presenting a diffuse NSP4-EGFP fluorescence for transfected cells or randomized for rotavirus- or mock-infected cells. The results are presented as the ratio of fura-2 fluorescence measured at 350- and 380-nm excitation wavelengths (see Materials and Methods). Permeability to Ca2+ was evaluated by monitoring the change in the fura-2 ratio upon switching solutions from 1 mM to 5 mM CaCl2. The state of filling of agonist-sensitive sequestered Ca2+ pools was evaluated by the addition of ATP (250 μM). In the left-hand panels, the traces correspond to measurements in individual mock-infected, rotavirus-infected, or NSP4-EGFP-expressing cells. The lower right-hand panel depicts the average trace (± SEM; light colors) for each condition (mock, n = 12; virus, n = 14; NSP4-EGFP, n = 11). A representative experiment from a series of four is shown.
FIG. 7.
FIG. 7.
Effects, of NSP4, EGFP-VP4, and EGFP expression and rotavirus infection on the fura-2 ratio in Cos-7 cells. Cos-7 cells were transiently transfected with plasmids encoding NSP4 (A) or EGFP or EGFP-VP4 (B) for 24 h. The cells were then processed for Ca2+ measurements as for Fig. 6. The traces on the left correspond to fura-2 ratio measurements in 13 individual NSP4-expressing cells (A) and 15 individual EGFP- or EGFP-VP4-expressing cells (B). On the right are depicted the average traces (± SEM; light colors) for NSP4- or EGFP- and EGFP-VP4-expressing cells. An average trace (± SEM; light colors) is presented for mock conditions. A representative experiment is shown.
FIG. 8.
FIG. 8.
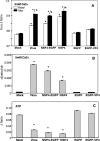
Analysis of the effects of NSP4-EGFP, NSP4, EGFP-VP4, or EGFP expression and rotavirus infection on the fura-2 ratio in Cos-7 cells and on plasma membrane permeability to Ca2+ and agonist-releasable Ca2+ pools in Cos-7 cells. (A, B, and C) Analysis of experiments performed as for Fig. 6 and 7. (A) Data representing the fura-2 ratio before (Basal) and after (Max) the addition of 5 mM Ca2+ to the extracellular medium. (B) The bars correspond to the initial rates of fura-2 ratio change [d(ratio)/dt] induced by the addition of 5 mM CaCl2 to the extracellular medium (protocol as in Fig. 6A and 7A). (C) The data correspond to the amplitude of the Ca2+ spike (Δ ratio) induced by the addition of 250 μM ATP to Cos-7 cells. The bars correspond to the means plus SEM of n values; n (cells/days) = 60/4 (Mock), 45/3 (Virus), 55/4 (NSP4-EGFP), 30/2 (NSP4), 32/2 (EGFP), 30/2 (EGFP-VP4). Statistical analysis was performed using Student's t test. In panel A, the symbols are as follows: *, significant difference (P < 0.001, at least) between the basal ratio under experimental conditions (virus or transfected) and controls (mock); ♡, significant difference (P < 0.001, at least) between the maximal ratio under experimental conditions (virus or transfected) and controls (mock); ♠, significant difference (P < 0.001, at least) between the basal and maximal ratios (before and after 5 mM Ca2+) under each experimental condition. In panels B and C, * indicates a significant difference (P < 0.001, at least) between values under experimental conditions (virus or transfected) and controls (mock). Nonsignificant differences have no symbols.
FIG. 9.
FIG. 9.
Relationship between changes in the fura-2 ratio and the level of expression of NSP4-EGFP. Cos-7 cells grown on glass coverslips were transfected with the pEGFP-N1NSP4 plasmid. At 24 h posttransfection, the cells were loaded with fura-2. First, an image of the field was captured at excitation/emission wavelengths of 500/535 nm to measure the intensity of green fluorescence of NSP4-EGFP for each cell selected for fura-2 ratio measurement. Quantification of the fluorescence emitted by the EGFP group in individual cells was performed on images using ImageJ software. To evaluate the Ca2+ permeability of the plasma membrane, we followed the same protocol as for Fig. 6. (A) Plot of the initial rate of ratio increase [d(ratio)/dt] as a function of the intensity of green fluorescence. (B) Plot of the amplitude of the peak ratio induced by the increase in the extracellular Ca2+ concentration ([Ca2+]out) from 1 to 5 mM Ca2+ as a function of the intensity of green fluorescence. Each point corresponds to the measurement of an individual cell of the same monolayer (n = 13). A representative experiment from a series of two is shown. R, correlation coefficient. a.u., arbitrary units.
FIG. 10.
FIG. 10.
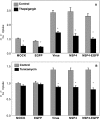
Effects of NSP4 expression on 45Ca2+ uptake in transfected cells. Cos-7 cells grown in 24-well plates were transiently transfected with plasmids encoding NSP4-EGFP, NSP4, or EGFP for 30 h or were infected with RF rotavirus for 8 h. Thapsigargin (3 μM) was added 30 min before measurement at the end of the transfection or infection period (A). Tunicamycin (5 μg/ml) was added at 10 h posttransfection or 1 h postinfection (B). The time of 45Ca2+ uptake was 10 min. The counts obtained in virus-infected or -transfected cells were normalized to those for uninfected and untransfected cells. The values correspond to the means plus SEM of 6 measurements (two independent experiments with three replicates) (A) and 12 measurements (four independent experiments with three replicates) (B). *, P < 0.001 (paired t test).

Similar articles

Cited by

References

    1. Altenburg, B. C., D. Y. Graham, and M. K. Estes. 1980. Ultrastructural study of rotavirus replication in cultured cells. J. Gen. Virol. 4675-85. - PubMed
    1. Au, K. S., W. K. Chan, J. W. Burns, and M. K. Estes. 1989. Receptor activity of rotavirus nonstructural glycoprotein NS28. J.Virol. 634553-4562. - PMC - PubMed
    1. Ball, J. M., P. Tian, C. Q. Zeng, A. P. Morris, and M. K. Estes. 1996. Age-dependent diarrhea induced by a rotaviral nonstructural glycoprotein. Science 272101-104. - PubMed
    1. Bergmann, C. C., D. Maass, M. S. Poruchynsky, P. H. Atkinson, and A. R. Bellamy. 1989. Topology of the non-structural rotavirus receptor glycoprotein NS28 in the rough endoplasmic reticulum. EMBO J. 81695-1703. - PMC - PubMed
    1. Berkova, Z., S. E. Crawford, G. Trugnan, T. Yoshimori, A. P. Morris, and M. K. Estes. 2006. Rotavirus NSP4 induces a novel vesicular compartment regulated by calcium and associated with viroplasms. J. Virol. 806061-6071. - PMC - PubMed

Publication types

LinkOut - more resources