. 2009 Jan;150(1):14-23.
doi: 10.1210/en.2008-0984. Epub 2008 Sep 11.

Argonaute-2 expression is regulated by epidermal growth factor receptor and mitogen-activated protein kinase signaling and correlates with a transformed phenotype in breast cancer cells

Affiliations

Argonaute-2 expression is regulated by epidermal growth factor receptor and mitogen-activated protein kinase signaling and correlates with a transformed phenotype in breast cancer cells

Brian D Adams et al. Endocrinology. 2009 Jan.

Abstract

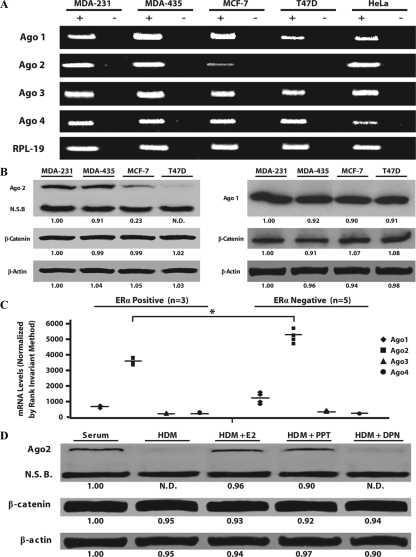
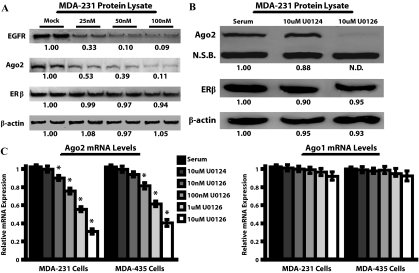
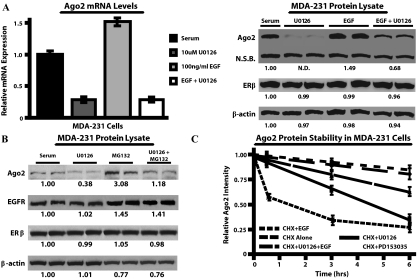
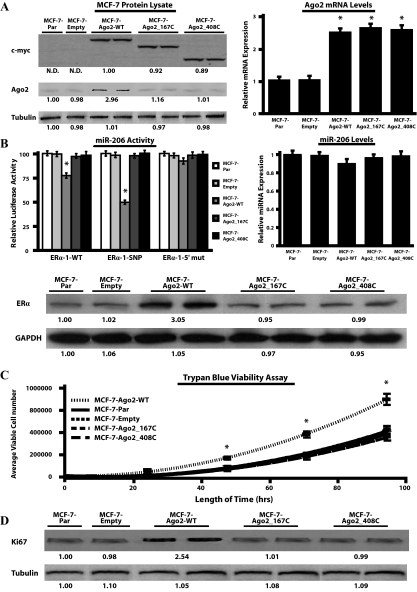
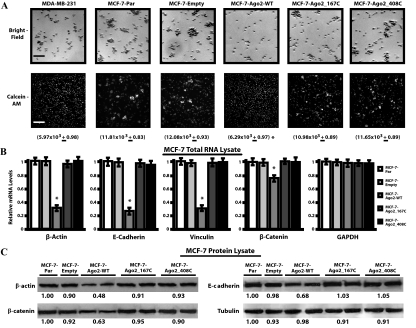
Argonaute (Ago) 2 is the catalytic engine of mammalian RNA interference, but little is known concerning the regulation of Ago2 by cell-signaling pathways. In this study we show that expression of Ago2, but not Ago1, Ago3, or Ago4, is elevated in estrogen receptor (ER) alpha-negative (ERalpha(-)) vs. ERalpha-positive (ERalpha+) breast cancer cell lines, and in ERalpha(-) breast tumors. In MCF-7 cells the low level of Ago2 was found to be dependent upon active ERalpha/estrogen signaling. Interestingly, the high expression of Ago2 in ERalpha(-) cells was severely blunted by inhibition of the epidermal growth factor (EGF) receptor/MAPK signaling pathway, using either a pharmacological MAPK kinase inhibitor, U0126, or a small interfering RNA directed against EGF receptor. Half-life studies using cycloheximide indicated that EGF enhanced, whereas U0126 decreased, Ago2 protein stability. Furthermore, a proteosome inhibitor, MG132, blocked Ago2 protein turnover. The functional consequences of elevated Ago2 levels were examined by stable transfection of ERalpha+ MCF-7 cells with full-length and truncated forms of Ago2. The full-length Ago2 transfectants displayed enhanced proliferation, reduced cell-cell adhesion, and increased migratory ability, as shown by proliferation, homotypic aggregation, and wound healing assays, respectively. Overexpression of full-length Ago2, but not truncated forms of Ago2 or an empty vector control, reduced the levels of E-cadherin, beta-catenin, and beta-actin, as well as enhanced endogenous miR-206 activity. These data indicate that Ago2 is regulated at both the transcriptional and posttranslational level, and also implicate Ago2 and enhanced micro-RNA activity in the tumorigenic progression of breast cancer cell lines.


Figures

Figure 1
Figure 1
Ago2 expression is highly abundant in ERα breast cancer cell lines. A, End-point RT-PCR of endogenous Ago1-4 and RPL-19 mRNA levels in the four breast cancer cell types, as well as HeLa cell lines. After 25 cycles (Ago1, Ago2, RPL-19) or 30 cycles (Ago3, Ago4) of amplification, the resultant band intensities for each cell type are depicted. Plus (+)/minus (−) symbols indicate plus or minus reverse transcriptase reactions. B, Western blot analysis of Ago2 protein expression in ERα+ (MCF-7 and T47D) and ERα (MDA-MB-231 and MDA-MB-435) breast tumor cell lines. Values below each blot depict mean Ago2, β-catenin, and β-actin expression from four independent experiments, relative to MDA-MB-231 samples. C, Distribution plot of Ago1-4 mRNA levels in ERα+ and ERα human breast tumors. Each point represents levels of a particular Ago within an individual sample after Rank invariant normalization. Horizontal bars denote mean Ago1-4 transcript levels within a data set (*, P < 0.005). D, Western blot analysis of Ago2, β-catenin, and β-actin expression in MCF-7 cells cultured in serum, HDM, or HDM with either 1.5 nm E2, 10 nm PPT, or 10 nm DPN for 48 h. Values below each blot represent mean band intensity from four independent experiments, and are reported as relative to the serum control. N.D., Nondetectable densitometric reading; N.S.B., 85-kDa nonspecific band detected by the Ago2 antibody.
Figure 2
Figure 2
Abrogating MAPK signaling reduces Ago2 expression in MDA-MB-231 cells. A, MDA-MB-231 cells were transfected with 0–100 nm siEGFR for 24 h, and analyzed for Ago2, EGFR, ERβ, and β-actin protein expression via Western blot. The numbers below each band represent the mean densitometric readings from four independent experiments, relative to the serum control, which was set at 1.00. B, Western blot analysis of Ago2, ERβ, and β-actin protein expression in MDA-MB-231 cells treated with U0124, U0126, or serum alone for 48 h. N.D., Nondetectable densitometric reading; N.S.B., 85-kDa nonspecific band detected by the Ago2 antibody. C, MDA-MB-231 and MDA-MB-435 cell lines cultured in normal serum conditions were treated with 0–10 μm U0126, or 10 μm U0124 for 48 h, and Ago2 and Ago1 mRNA levels were assayed by real-time PCR. Values were normalized to RPL-19 and are reported as the mean + sem of three independent experimenters with five replicates per experiment, relative to serum-treated samples (*, P < 0.01, compared with serum control).
Figure 3
Figure 3
EGF enhances Ago2 protein stability through active EGFR/MAPK signaling. A, MDA-MB-231 cells were treated with 10 μm U0126 and/or 100 ng/ml EGF for 48 h, and Ago2 mRNA levels were assayed by real-time PCR (left panel). Values (mean + sem) were obtained from three experiments with five replicates per experiment, normalized to RPL-19, and depicted as relative to serum-treated samples. Western blot analysis of Ago2, ERβ, and β-actin protein expression in MDA-MB-231 cells under the same conditions as noted previously (right panel). N.D., Nondetectable densitometric reading; N.S.B., 85-kDa nonspecific band detected by the Ago2 antibody. B, MDA-MB-231 cells were treated with serum alone plus 10 μm MG132, or 10 μm U0126 plus 10 μm MG132, and analyzed for the expression of the proteins noted previously. For all Western blots, the numbers below the band represents the mean densitometric readings from four experiments, relative to the serum control. C, CHX stability studies were performed in MDA-MB-231 cells. Each point within a line graph represents the mean + sem for Ago2 expression from four independent experiments, normalized to cell number, and reported as relative to CHX alone at 0 h. At 3 h, PD153035 or U0126 significantly (P < 0.05) reduced Ago2 levels compared with U0126 plus EGF or CHX alone.
Figure 4
Figure 4
Overexpression of Ago2 induces alterations in the phenotype of MCF-7 cells. A, MCF-7-Ago2 transfectants (MCF-7-Ago2-WT, MCF-7-Ago2_167C, and MCF-7-Ago2_408C) were screened for myc-epitope and Ago2 expression by Western blot analysis (left panel). The densitometry readings depicted below each Western blot represent the mean myc-epitope, Ago2, and tubulin expression. Real-time PCR was performed to monitor Ago2 transcript levels in the MCF-7 transfectants (right panel). Values were normalized to RPL-19 and reported as relative to MCF-7 parental (MCF-7-Par) cells. B, Luciferase assays using the pIS-ERα-1 constructs were performed to monitor miR-206 activity in the MCF-7-Ago2 transfectants (left panel), whereas real-time PCR was performed to determine mature miR-206 levels (right panel). Values from the luciferase and real-time PCR assays were normalized to Renilla luciferase or 5s RNA, respectively, and reported as relative to the levels in MCF-7-Par cells. Western blots were also performed to measure endogenous ERα expression in the various MCF-7 transfectants (bottom panel). C, The number of viable MCF-7 transfectants was determined by Trypan blue growth curves as described in Materials and Methods. D, Western blot analysis of Ki67 expression levels in the MCF-7 transfectants. Numbers below bands represent the average densitometric readings for Ki67 and tubulin expression relative to MCF-7-Par cells. For all assays three independent experiments were performed in quadruplicate, and values were reported as the mean + sem. Data generated from the Ago2 transfectants are representative of three stably selected pools of cells with equivalent WT or mutant Ago2 expression (*, P < 0.05, compared with MCF-7-Par control). GAPDH, Glyceraldehyde-3-phosphate dehydrogenase; N.D., nondetectable densitometric reading; SNP, single nucleotide polymorphism.
Figure 5
Figure 5
Ago2 reduces cell adhesion molecule expression and homotypic aggregation. A, Bright-field (top panel) and fluorescent Calcein-AM (bottom panel) images of fixed cell aggregates from a representative experiment are shown. Quantification of the homotypic aggregation assay was obtained from three independent experiments performed in duplicate, and values under each picture represent the average number of aggregates per ml of sample + sem. Scale bars represent a length of approximately 350 μm. B, Total RNA from the cell types mentioned previously was analyzed via real-time PCR for β-actin, E-cadherin, vinculin, β-catenin, and glyceraldehyde-3-phosphate dehydrogenase (GAPDH) mRNA levels. Values were normalized to RPL-19 and reported as the mean + sem, relative to the MCF-7-Par samples. C, Western blot analyses on the cell types noted previously. Each blot indicates the representative expression of β-actin, E-cadherin, β-catenin, and tubulin in each of the respective cell types. Values under each band represent the average densitometric intensity of protein expression relative to the MCF-7-Par cell line. Data collected from the Ago2 transfectants are representative of three stably selected pools of cells with equal WT or mutant Ago2 expression (*, P < 0.05, compared with MCF-7-Par control).

References

    1. Meister G, Tuschl T 2004 Mechanisms of gene silencing by double-stranded RNA. Nature 431:343–349 - PubMed
    1. Filipowicz W, Jaskiewicz L, Kolb FA, Pillai RS 2005 Post-transcriptional gene silencing by siRNAs and miRNAs. Curr Opin Struct Biol 15:331–341 - PubMed
    1. Gregory RI, Yan KP, Amuthan G, Chendrimada T, Doratotaj B, Cooch N, Shiekhattar R 2004 The microprocessor complex mediates the genesis of microRNAs. Nature 432:235–240 - PubMed
    1. Wu L, Fan J, Belasco JG 2006 MicroRNAs direct rapid deadenylation of mRNA. Proc Natl Acad Sci USA 103:4034–4039 - PMC - PubMed
    1. Pillai RS, Bhattacharyya SN, Artus CG, Zoller T, Cougot N, Basyuk E, Bertrand E, Filipowicz W 2005 Inhibition of translational initiation by Let-7 MicroRNA in human cells. Science 309:1573–1576 - PubMed

Publication types

MeSH terms