

Transmural variation in myosin heavy chain isoform expression modulates the timing of myocardial force generation in porcine left ventricle
- PMID: 18787035
- PMCID: PMC2652156
- DOI: 10.1113/jphysiol.2008.160390
Transmural variation in myosin heavy chain isoform expression modulates the timing of myocardial force generation in porcine left ventricle
Abstract
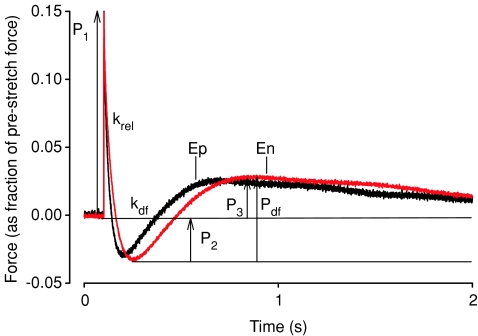
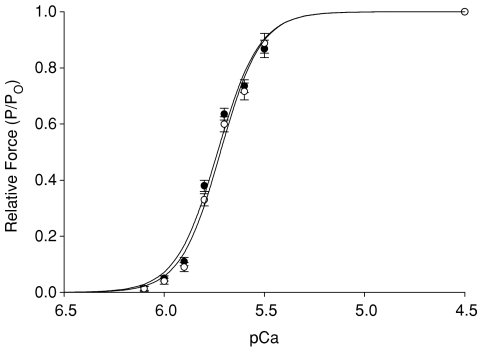
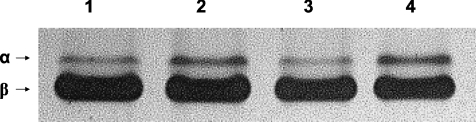
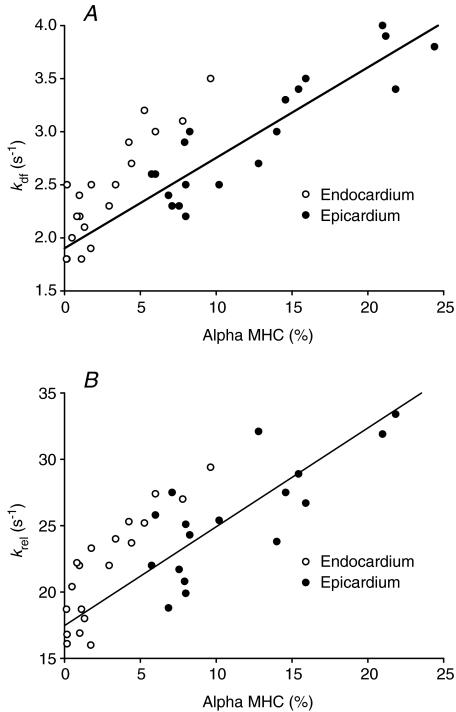
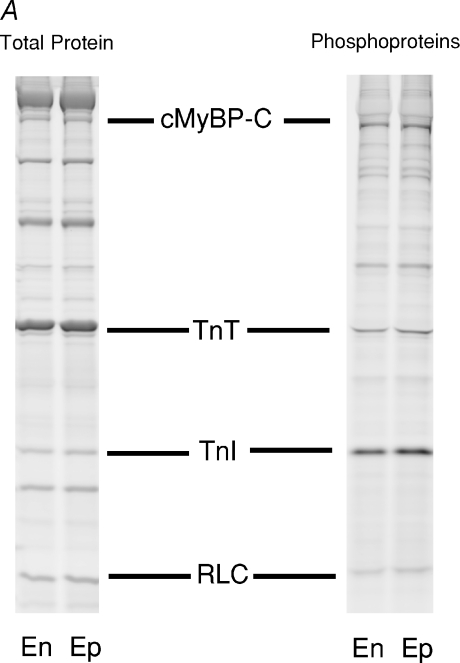
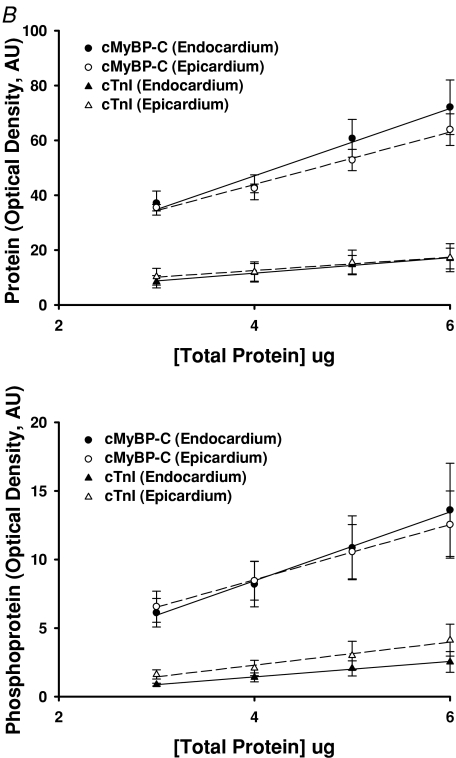
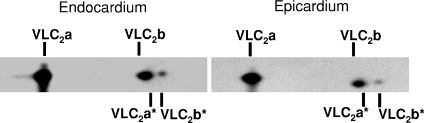
Recent studies have shown that the sequence and timing of mechanical activation of myocardium vary across the ventricular wall. However, the contributions of variable expression of myofilament protein isoforms in mediating the timing of myocardial activation in ventricular systole are not well understood. To assess the functional consequences of transmural differences in myofilament protein expression, we studied the dynamic mechanical properties of multicellular skinned preparations isolated from the sub-endocardial and sub-epicardial regions of the porcine ventricular midwall. Compared to endocardial fibres, epicardial fibres exhibited significantly faster rates of stretch activation and force redevelopment (k(tr)), although the amount of force produced at a given [Ca2+] was not significantly different. Consistent with these results, SDS-PAGE analysis revealed significantly elevated expression of alpha myosin heavy chain (MHC) isoform in epicardial fibres (13 +/- 1%) versus endocardial fibres (3 +/- 1%). Linear regression analysis revealed that the apparent rates of delayed force development and force decay following stretch correlated with MHC isoform expression (r2 = 0.80 and r2 = 0.73, respectively, P < 0.05). No differences in the relative abundance or phosphorylation status of other myofilament proteins were detected. These data show that transmural differences in MHC isoform expression contribute to regional differences in dynamic mechanical function of porcine left ventricles, which in turn modulate the timing of force generation across the ventricular wall and work production during systole.
Figures
Similar articles
-
Role of myosin heavy chain composition in the stretch activation response of rat myocardium.J Physiol. 2007 Feb 15;579(Pt 1):161-73. doi: 10.1113/jphysiol.2006.119719. Epub 2006 Nov 30. J Physiol. 2007. PMID: 17138609 Free PMC article.
-
Developmental increase in β-MHC enhances sarcomere length-dependent activation in the myocardium.J Gen Physiol. 2019 May 6;151(5):635-644. doi: 10.1085/jgp.201812183. Epub 2019 Jan 2. J Gen Physiol. 2019. PMID: 30602626 Free PMC article.
-
Altered in vivo left ventricular torsion and principal strains in hypothyroid rats.Am J Physiol Heart Circ Physiol. 2010 Nov;299(5):H1577-87. doi: 10.1152/ajpheart.00406.2010. Epub 2010 Aug 20. Am J Physiol Heart Circ Physiol. 2010. PMID: 20729398 Free PMC article.
-
[Transmural heterogeneity of the left ventricular wall: subendocardial layer and subepicardial layer].J Cardiol. 2000 Mar;35(3):205-18. J Cardiol. 2000. PMID: 10808428 Review. Japanese.
-
Regional variation in myofilament length-dependent activation.Pflugers Arch. 2011 Jul;462(1):15-28. doi: 10.1007/s00424-011-0933-6. Epub 2011 Feb 19. Pflugers Arch. 2011. PMID: 21336586 Review.
Cited by
-
Effect of Transmural Differences in Excitation-Contraction Delay and Contraction Velocity on Left Ventricle Isovolumic Contraction: A Simulation Study.Biomed Res Int. 2018 May 10;2018:4798512. doi: 10.1155/2018/4798512. eCollection 2018. Biomed Res Int. 2018. PMID: 29862273 Free PMC article.
-
Transmural gradients of myocardial structure and mechanics: Implications for fiber stress and strain in pressure overload.Prog Biophys Mol Biol. 2016 Dec;122(3):215-226. doi: 10.1016/j.pbiomolbio.2016.11.004. Epub 2016 Nov 11. Prog Biophys Mol Biol. 2016. PMID: 27845176 Free PMC article. Review.
-
Effect of Myosin Isoforms on Cardiac Muscle Twitch of Mice, Rats and Humans.Int J Mol Sci. 2022 Jan 20;23(3):1135. doi: 10.3390/ijms23031135. Int J Mol Sci. 2022. PMID: 35163054 Free PMC article.
-
Myocardial hypertrophy reduces transmural variation in mitochondrial function.Front Physiol. 2014 May 7;5:178. doi: 10.3389/fphys.2014.00178. eCollection 2014. Front Physiol. 2014. PMID: 24847280 Free PMC article. No abstract available.
-
Critical Evaluation of Current Hypotheses for the Pathogenesis of Hypertrophic Cardiomyopathy.Int J Mol Sci. 2022 Feb 16;23(4):2195. doi: 10.3390/ijms23042195. Int J Mol Sci. 2022. PMID: 35216312 Free PMC article. Review.
References
-
- Bogaert J, Rademakers FE. Regional nonuniformity of normal adult human left ventricle. Am J Physiol Heart Circ Physiol. 2001;283:H792–H799. - PubMed
-
- Bougaisky LB, Anderson PG, Hall RS, Bishop SP. Differences in myosin isoform expression in the subepicardial and subendocardial myocardium during cardiac hypertrophy in the rat. Circ Res. 1990;66:1127–1132. - PubMed
-
- Bouvagnet P, Mairhofer H, Leger JO, Puech P, Leger JJ. Distribution pattern of alpha and beta myosin in normal and diseased human ventricular myocardium. Basic Res Cardiol. 1989;84:91–102. - PubMed
Publication types
MeSH terms
Substances
Grants and funding
LinkOut - more resources
Full Text Sources
Other Literature Sources
Research Materials
Miscellaneous