

Effects of volitional contraction on intracortical inhibition and facilitation in the human motor cortex
- PMID: 18787036
- PMCID: PMC2652145
- DOI: 10.1113/jphysiol.2008.158956
Effects of volitional contraction on intracortical inhibition and facilitation in the human motor cortex
Abstract
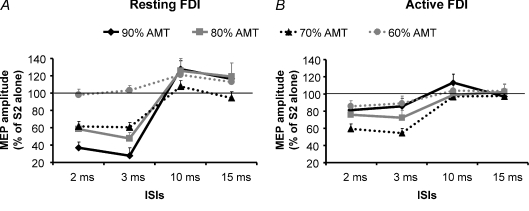
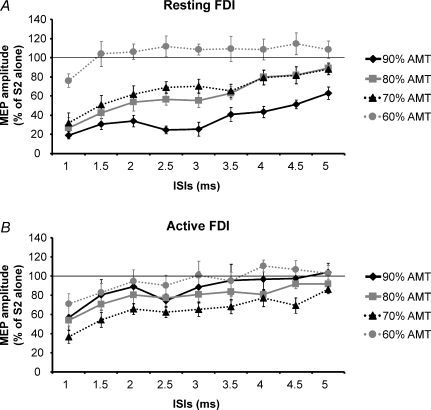
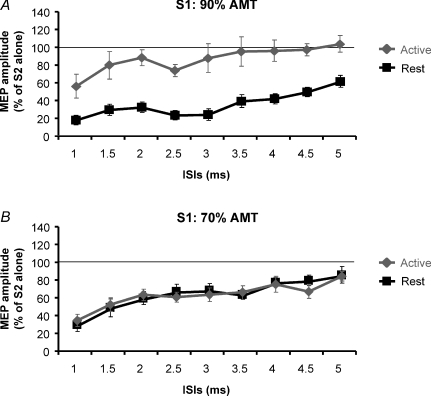
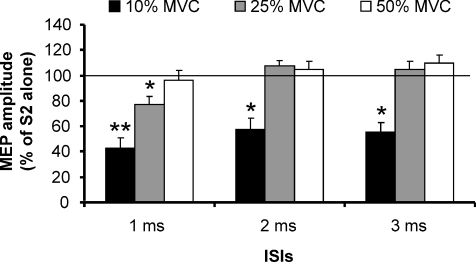
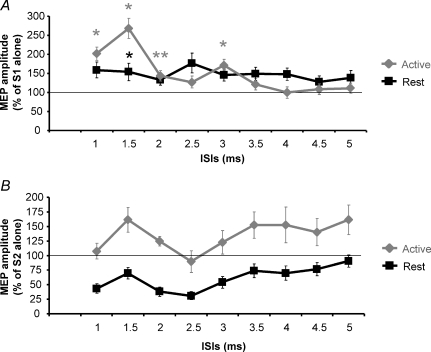
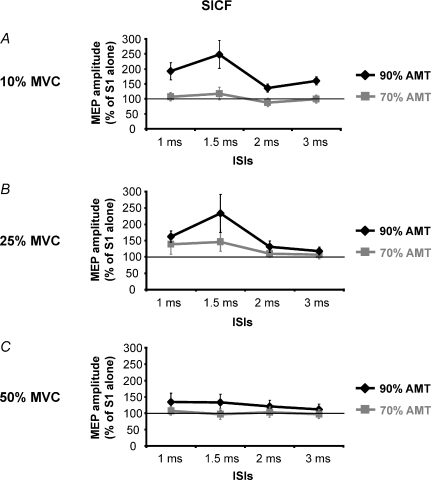
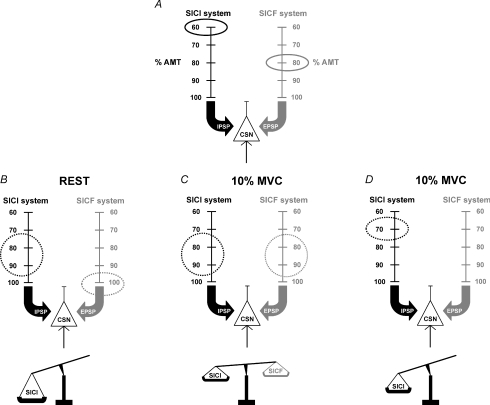
Short-interval intracortical inhibition (SICI), intracortical facilitation (ICF) and short-interval intracortical facilitation (SICF) were assessed in the cortical motor area of the first dorsal interosseous muscle (FDI) of 16 healthy subjects. Paired-pulse TMS was delivered to the left hemisphere at the following interstimulus intervals (ISIs): 2 and 3 ms for SICI, 10 and 15 ms for ICF and 1-5 ms for SICF. Motor-evoked potentials were recorded from the resting and active right FDI. The effects exerted on SICI and ICF by four intensities (60-90% of active motor threshold, AMT) of the conditioning stimulus (S1) and by three levels of muscle contraction (10%, 25%, 50% of maximal voluntary contraction, MVC) were evaluated. The effects exerted on SICF were evaluated with two intensities (90% and 70% of AMT) of the test stimulus (S2) and with the same levels of muscle contraction. Results showed that: (i) during 10% MVC, maximum SICI was observed with S1 = 70% AMT; (ii) the amount of SICI obtained with S1 = 70% AMT was the same at rest as during 10% MVC, but decreased at higher contraction levels; (iii) ICF was observed only at rest with S1 = 90% AMT; (iv) SICF was facilitated at 10% and 25% MVC, but not at 50% MVC. We conclude that during muscle activation, intracortical excitability reflects a balance between activation of SICI and SICF systems. Part of the reduction in SICI during contraction is due to superimposed recruitment of SICF. Low intensity (70% AMT) conditioning stimuli can test SICI independently of effects on SICF at low contraction levels.
Figures
Similar articles
-
Effects of short interval intracortical inhibition and intracortical facilitation on short interval intracortical facilitation in human primary motor cortex.J Physiol. 2009 Dec 1;587(Pt 23):5665-78. doi: 10.1113/jphysiol.2009.181446. Epub 2009 Oct 12. J Physiol. 2009. PMID: 19822548 Free PMC article.
-
Interference of short-interval intracortical inhibition (SICI) and short-interval intracortical facilitation (SICF).Clin Neurophysiol. 2008 Oct;119(10):2291-7. doi: 10.1016/j.clinph.2008.05.031. Epub 2008 Aug 23. Clin Neurophysiol. 2008. PMID: 18723394
-
Short-interval paired-pulse inhibition and facilitation of human motor cortex: the dimension of stimulus intensity.J Physiol. 2002 Nov 15;545(1):153-67. doi: 10.1113/jphysiol.2002.030122. J Physiol. 2002. PMID: 12433957 Free PMC article.
-
Modulation of the cortical silent period elicited by single- and paired-pulse transcranial magnetic stimulation.BMC Neurosci. 2013 Apr 2;14:43. doi: 10.1186/1471-2202-14-43. BMC Neurosci. 2013. PMID: 23547559 Free PMC article.
-
Influence of short-interval intracortical inhibition on short-interval intracortical facilitation in human primary motor cortex.J Neurophysiol. 2010 Sep;104(3):1382-91. doi: 10.1152/jn.00164.2010. Epub 2010 May 26. J Neurophysiol. 2010. PMID: 20505127 Clinical Trial.
Cited by
-
The influence of sensory afferent input on local motor cortical excitatory circuitry in humans.J Physiol. 2015 Apr 1;593(7):1667-84. doi: 10.1113/jphysiol.2014.286245. Epub 2015 Jan 30. J Physiol. 2015. PMID: 25832926 Free PMC article.
-
Contribution of TMS and TMS-EEG to the Understanding of Mechanisms Underlying Physiological Brain Aging.Brain Sci. 2021 Mar 22;11(3):405. doi: 10.3390/brainsci11030405. Brain Sci. 2021. PMID: 33810206 Free PMC article. Review.
-
Corticomotor control of deep abdominal muscles in chronic low back pain and anticipatory postural adjustments.Exp Brain Res. 2012 Apr;218(1):99-109. doi: 10.1007/s00221-012-3008-9. Epub 2012 Feb 5. Exp Brain Res. 2012. PMID: 22311467
-
Effects of short interval intracortical inhibition and intracortical facilitation on short interval intracortical facilitation in human primary motor cortex.J Physiol. 2009 Dec 1;587(Pt 23):5665-78. doi: 10.1113/jphysiol.2009.181446. Epub 2009 Oct 12. J Physiol. 2009. PMID: 19822548 Free PMC article.
-
Can training of a skilled pelvic movement change corticomotor control of back muscles? Comparison of single and paired-pulse transcranial magnetic stimulation.Eur J Neurosci. 2022 Jul;56(1):3705-3719. doi: 10.1111/ejn.15683. Epub 2022 May 10. Eur J Neurosci. 2022. PMID: 35501123 Free PMC article.
References
-
- Awiszus F, Feistner H, Urbach D, Bostock H. Characterisation of paired-pulse transcranial magnetic stimulation conditions yielding inhibition or I-wave facilitation using a threshold-hunting paradigm. Exp Brain Res. 1999;129:317–324. - PubMed
-
- Chen R, Garg R. Facilitatory I wave interaction in proximal arm and lower limb muscle representations of the human motor cortex. J Neurophysiol. 2000;83:1426–1434. - PubMed
-
- Di Lazzaro V, Oliviero A, Meglio M, Cioni B, Tamburrini G, Tonali P, Rothwell JC. Direct demonstration of the effect of lorazepam on the excitability of the human motor cortex. Clin Neurophysiol. 2000;111:794–799. - PubMed
-
- Di Lazzaro V, Oliviero A, Profice P, Saturno E, Pilato F, Insola A, Mazzone P, Tonali P, Rothwell JC. Comparison of descending volleys evoked by transcranial magnetic and electric stimulation in conscious humans. Electroencephalogr Clin Neurophysiol. 1998a;109:397–401. - PubMed
-
- Di Lazzaro V, Restuccia D, Oliviero A, Profice P, Ferrara L, Insola A, Mazzone P, Tonali P, Rothwell JC. Magnetic transcranial stimulation at intensities below active motor threshold activates intracortical inhibitory circuits. Exp Brain Res. 1998b;119:265–268. - PubMed
Publication types
MeSH terms
Grants and funding
LinkOut - more resources
Full Text Sources