. 2008 Nov;22(11):2420-32.
doi: 10.1210/me.2007-0481. Epub 2008 Sep 11.

Target gene-specific regulation of androgen receptor activity by p42/p44 mitogen-activated protein kinase

Affiliations

Target gene-specific regulation of androgen receptor activity by p42/p44 mitogen-activated protein kinase

Irina U Agoulnik et al. Mol Endocrinol. 2008 Nov.

Abstract

Evidence that the androgen receptor (AR) is not only important in androgen-dependent prostate cancer, but also continues to play a role in tumors that become resistant to androgen deprivation therapies, highlights the need to find alternate means to block AR activity. AR, a hormone-activated transcription factor, and its coactivators are phosphoproteins. Thus, we sought to determine whether inhibition of specific cell signaling pathways would reduce AR function. We found that short-term inhibition of p42/p44 MAPK activity either by a MAPK kinase inhibitor, U0126, or by depletion of kinase with small interfering RNA caused target gene-specific reductions in AR activity. AR enhances histone H3 acetylation of target genes that are sensitive to U0126 including prostate-specific antigen and TMPRSS2, but does not increase histone H3 acetylation of the U0126-resistant PMEPA1 gene. Thus, although AR induces transcription of many target genes, the molecular changes induced by AR at the chromatin level are target gene specific. Long-term treatment (24-48 h) with U0126 causes a G1 cell cycle arrest and reduces AR expression both through a decrease in AR mRNA and a reduction in AR protein stability. Thus, treatments that reduce p42/p44 MAPK activity in prostate cancer have the potential to reduce AR activity through a reduction in expression levels as well as by target gene-selective inhibition of AR function.


Figures
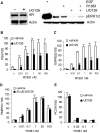
Figure 1
Figure 1
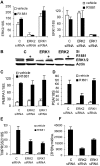
MAPK Signaling Is Required for Optimal AR Transcriptional Activity A, LNCaP cells were preincubated for 24 h in medium supplemented with 10% charcoal stripped serum (sFBS), 1 nm R1881, and vehicle (DMSO) or 20 μm UO126 was added to the medium and cells incubated for 12 h; except 100 ng/ml of EGF was added where indicated only for the last 10 min. Cells were harvested and AR, phospho-ERK1/2, and actin expression was measured by Western blotting. B–E, LNCaP cells were treated with the indicated amount of R1881 and either DMSO as a vehicle or 20 μm UO126 for 12 h. Total RNA was prepared as described in Materials and Methods and analyzed for PSA (B), TMPRSS2 (C), PMEPA1 (D), and PCDH11 (E) expression by quantitative RT-PCR. All expression values were normalized to 18S RNA expression, each point was done in triplicate, and mean and sd were calculated. The experiments were repeated three times, and a representative experiment is shown. v, Vehicle.
Figure 2
Figure 2
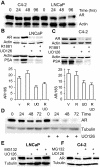
Individual Contributions of ERK1 and ERK2 to AR Signaling Two million LNCaP cells were electroporated with 800 pmol of either noncoding control siRNA (Dharmacon), MAPK1 (ERK2) smart pool siRNA (Dharmacon), or MAPK3 (ERK1) siRNA (Dharmacon) using an Amaxa electroporator and R Kit (Amaxa). A, Cells electroporated with the indicated siRNAs were plated on polylysine-coated plates at 260,000 cells per well in six-well plates and after 24 h were treated with 1 nm R1881 or vehicle for 12 h. Total RNA was extracted and analyzed for ERK2 (left panel), ERK1 (right panel), and 18S expression by quantitative RT-PCR. ERK1 and ERK2 expression levels were normalized for 18S expression. B, LNCaP cells were transfected and treated in parallel with panel A and cells were harvested and analyzed for ERK1, ERK2 and actin expression by Western blotting. C–E, RNA from panel A was analyzed for PMEPA1 (C), PSA (D), and TMPRSS2 (E) expression by quantitative RT-PCR, and their expression levels were normalized to 18S expression. F, LNCaP cells electroporated with control, ERK2, or ERK1 smart pools (Dharmacon) were plated at a concentration of 5000 cells per well. Cells were treated 24 h after transfection with 1 nm R1881 for 12 h, and cell proliferation was compared using a [3H]thymidine incorporation assay. Each point was done in triplicate, average and sd were calculated, and experiments were performed four times. C, Control.
Figure 3
Figure 3
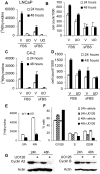
MAPK Signaling Affects Inter- and Intramolecular AR Interactions A, PC-3 cells were transfected with 400 ng 17mer-Luc, and the indicated combinations of 100 ng of pBind (Promega) or pBind-AR-NTD, 100 ng of pAct (Promega) or pAct-AR-DH as described in Materials and Methods. Cells were treated with either vehicle or 10 nm R1881 with or without 20 μm U0126 overnight and assayed for luciferase activity, which was then normalized for the level of total protein. On the right, PC-3 cells were transfected with 400 ng of 17mer-Luc reporter and 10 ng of pBind-VP16 expression plasmid. Cells were then treated with either DMSO or 20 μm UO126 overnight, harvested, and assayed for luciferase activity and total protein. B, PC-3 cells were transfected with 400 ng 17mer-Luc, the indicated combinations of 100 ng of pBind or pBind-SRC-1a, and 100 ng of pAct or pAct-AR. Cells were treated overnight with either vehicle (empty bars) or 10 nm R1881 (solid bars), and either DMSO or 20 μm UO126 as indicated. Cells were harvested and assayed for luciferase activity and protein concentration. In experiments A and B, each point was done in triplicate, the experiments were repeated three times, and a representative experiment is shown. C and D, COS1 cells were transfected with flag-SRC-1 expression plasmid. After 24 h cells were treated with either DMSO or 20 μm UO126 for 12 h and harvested, and protein was extracted in the presence of protease and phosphatase inhibitors. Protein from each treatment group (1.5 mg) was used for immunoprecipitation (IP) with SRC-1-specific antibody. In panel C, lanes 1 and 2 are 50 μg of the input protein extract treated with either DMSO or 20 μm UO126; lanes 3–6 are 10% of immunoprecipitated material from cells treated with DMSO (lanes 3–4) or UO126 (lanes 5–6), using beads alone (lanes 3 and 5) or with flag antibody (lanes 4 and 6) were resolved on 6.5% PAGE and analyzed by Western blotting with total SRC-1 antibody. In D, 40% of the immunoprecipitated material was resolved on two separate 6.5% gels and analyzed by Western blotting using either pThr1179 or pSer1185 phospho-specific antibody. E, LNCaP cells were electroporated with either control or SRC-1 siRNA and plated in medium supplemented with 10% sFBS. Cells were treated 24 h later with either control or 1 nm R1881 for another 24 h. RNA was isolated and analyzed for 18S, PCDH11, and SRC-1 expression. Expression in the cells transfected with control (C) siRNA and treated with vehicle was designated as 100%, and all other values were adjusted proportionally. Each point was done in triplicate, and the experiment was repeated three times. Ab, Antibody; Act, actin; Bind, binding; RLU, relative light units; WB, Western blotting.
Figure 4
Figure 4
Effect of Short-Term Inhibition of MAPK on AR Recruitment to the PSA Enhancer A–C, LNCaP cells were placed in medium supplemented with 10% sFBS for 36 h. Cells were treated with 20 μm UO126 or vehicle (DMSO) and with either vehicle (ethanol) for 16 h, or 1 nm R1881 for 16 h or for the final 1 h. The ChIP assay was performed using an AR-specific antibody as described in Materials and Methods. DNA recovered after the ChIP assay was amplified with PSA (A) and TMPRSS2 (B) enhancer and promoter-specific TaqMan primers and probe and the PMEPA1 enhancer sequence (C). Values were divided by the corresponding input levels, and the amount of recruitment in cells treated with both vehicles was assigned a value of 1 and all others were normalized to it. The results of three independent ChIP assays were averaged and sd was calculated. D, LNCaP cells treated in parallel with panel A were harvested and analyzed for AR and actin expression by Western blotting.
Figure 5
Figure 5
AR Target Genes Display Differential Dynamics of Histone Modification and Activation A–C, LNCaP cells were incubated in medium with 10% sFBS for 36 h. Cells were treated with 20 μm UO126 or DMSO, and either ethanol for 16 h or 1 nm R1881 for 16 h or for the final 1 h. ChIP was performed using antiacetyl H3 antibody (Millipore) as described in Materials and Methods. Immunoprecipitated DNA was analyzed for PSA promoter and enhancer sequences (A), TMPRSS2 promoter and enhancer (B), and PMEPA1 enhancer and immediate promoter sequences (C). In panels A–C, each point was done in duplicate, experiments were repeated three times, and fold induction was averaged. D, LNCaP cells were incubated for 36 h in 10% sFBS and treated with 1 nm R1881 for the indicated lengths of time. Cells were harvested and analyzed for PSA, PMEPA1, and 18S expression. Maximal expression during 16 h was assigned as 100%, and other values were proportionally adjusted. Each point was done in triplicate and average and se was calculated. The experiment was repeated three times and a representative experiment is shown.
Figure 6
Figure 6
Inhibition of MEK Reduces AR Stability A, LNCaP and C4-2 cells were plated in medium supplemented with 5% FBS and allowed to grow for 24 h. Cells were then rinsed with serum free medium and transferred to one supplemented with 5% sFBS for the indicated lengths of time. Cells were then harvested and analyzed for AR and actin expression by Western blotting. B, LNCaP cells grown in medium containing sFBS were treated with vehicle (V), 1 nm R1881 (R), 20 μm UO126 (UO), or 1 nm R1881 and 20 μm UO126 for 48 h. Upper, Cells were harvested, protein was extracted, and 20 μg was resolved on a 12.5% SDS-PAGE. The levels of AR, PSA, and actin were analyzed by Western blotting. Lower, Total RNA was extracted, analyzed for AR and 18S expression by quantitative RT-PCR, and AR expression was normalized to 18S RNA. For RNA analyses, each point was performed in triplicate, and the sd was calculated. C, C4-2 cells were treated and analyzed exactly as LNCaP cells in panel B. D, C4-2 cells were plated in medium with 5% sFBS and treated with 10 μg/ml cycloheximide and either DMSO or 20 μm UO126. At the indicated time points, cells were harvested, and protein was extracted and analyzed for expression of AR and tubulin. E and F, LNCaP (E) and C4-2 (F) cells plated in full serum were pretreated with 10 μm MG132 for 0.5 h and then with 20 μm UO126 as indicated. After 24 h, cells were harvested, and protein was extracted and analyzed for AR and tubulin expression by Western blotting.
Figure 7
Figure 7
UO126 Treatment Reduces Cell Proliferation and Induces G0/G1 Accumulation A, LNCaP cells were plated at 1.5 × 10⁵ cells per well in six-well plates in medium supplemented with 10% FBS. Cells were allowed to attach overnight and rinsed, and medium was substituted for one supplemented with either 10% sFBS or 10% FBS. Cells were then treated with either vehicle (V) (DMSO) or 20 μm UO126 (UO); 24 and 48 h later, cell proliferation was evaluated using [3H]thymidine incorporation. B, LNCaP cells were plated at 1.5 × 10⁵ cells per well and treated in parallel with panel A and harvested at either 24 or 48 h and counted using the Coulter counter. C, C4-2 cells were plated at 1.5 × 10⁵ cells per well in six-well plates. Cells were allowed to attach overnight, rinsed with serum free medium, and placed in a medium with either 5% sFBS or 5% FBS treated with DMSO or UO126 (UO) for 24 or 48 h, and proliferation was examined using [3H]thymidine incorporation. D, C4-2 cells were plated at 1.5 × 10⁵ cells per well and treated in parallel with panel C. Cells were counted at the indicated time points using a Coulter counter. E, PC-3 cells were plated at 50,000 cells per well in six-well plates, treated with either DMSO or 20 μm UO126, and incubated for 24 or 48 h. Cell proliferation was measured using a [3H] thymidine incorporation assay. F, LNCaP cells were treated with either vehicle (DMSO) or 20 μm UO126 for 24 and 48 h. Cells were harvested, fixed with ethanol, stained with propidium iodide, and used for fluorescence-activated cell sorting analysis to determine cell cycle distribution. G, LNCaP cells treated in parallel with F were used to analyze cyclin A2 and B expression by Western blotting.

Similar articles

Cited by

References

    1. Tomlins SA, Rhodes DR, Perner S, Dhanasekaran SM, Mehra R, Sun XW, Varambally S, Cao X, Tchinda J, Kuefer R, Lee C, Montie JE, Shah RB, Pienta KJ, Rubin MA, Chinnaiyan AM 2005 Recurrent fusion of TMPRSS2 and ETS transcription factor genes in prostate cancer. Science 310:644–648 - PubMed
    1. Chen CD, Welsbie DS, Tran C, Baek SH, Chen R, Vessella R, Rosenfeld MG, Sawyers CL 2004 Molecular determinants of resistance to antiandrogen therapy. Nat Med 10:33–39 - PubMed
    1. Zegarra-Moro OL, Schmidt LJ, Huang H, Tindall DJ 2002 Disruption of androgen receptor function inhibits proliferation of androgen-refractory prostate cancer cells. Cancer Res 62:1008–1013 - PubMed
    1. Agoulnik IU, Vaid A, Bingman 3rd WE, Erdeme H, Frolov A, Smith CL, Ayala G, Ittmann MM, Weigel NL 2005 Role of SRC-1 in the promotion of prostate cancer cell growth and tumor progression. Cancer Res 65:7959–7967 - PubMed
    1. Agoulnik IU, Weigel NL 2006 Androgen receptor action in hormone-dependent and recurrent prostate cancer. J Cell Biochem 99:362–372 - PubMed

Publication types

MeSH terms