. 2008 Nov;295(5):G1004-15.
doi: 10.1152/ajpgi.90382.2008. Epub 2008 Sep 11.

Extracellular nucleotides stimulate Cl- currents in biliary epithelia through receptor-mediated IP3 and Ca2+ release

Affiliations

Extracellular nucleotides stimulate Cl- currents in biliary epithelia through receptor-mediated IP3 and Ca2+ release

Amal K Dutta et al. Am J Physiol Gastrointest Liver Physiol. 2008 Nov.

Abstract

Extracellular ATP regulates bile formation by binding to P2 receptors on cholangiocytes and stimulating transepithelial Cl(-) secretion. However, the specific signaling pathways linking receptor binding to Cl(-) channel activation are not known. Consequently, the aim of these studies in human Mz-Cha-1 biliary cells and normal rat cholangiocyte monolayers was to assess the intracellular pathways responsible for ATP-stimulated increases in intracellular Ca(2+) concentration ([Ca(2+)](i)) and membrane Cl(-) permeability. Exposure of cells to ATP resulted in a rapid increase in [Ca(2+)](i) and activation of membrane Cl(-) currents; both responses were abolished by prior depletion of intracellular Ca(2+). ATP-stimulated Cl(-) currents demonstrated mild outward rectification, reversal at E(Cl(-)), and a single-channel conductance of approximately 17 pS, where E is the equilibrium potential. The conductance response to ATP was inhibited by the Cl(-) channel inhibitors NPPB and DIDS but not the CFTR inhibitor CFTR(inh)-172. Both ATP-stimulated increases in [Ca(2+)](i) and Cl(-) channel activity were inhibited by the P2Y receptor antagonist suramin. The PLC inhibitor U73122 and the inositol 1,4,5-triphosphate (IP3) receptor inhibitor 2-APB both blocked the ATP-stimulated increase in [Ca(2+)](i) and membrane Cl(-) currents. Intracellular dialysis with purified IP3 activated Cl(-) currents with identical properties to those activated by ATP. Exposure of normal rat cholangiocyte monolayers to ATP increased short-circuit currents (I(sc)), reflecting transepithelial secretion. The I(sc) was unaffected by CFTR(inh)-172 but was significantly inhibited by U73122 or 2-APB. In summary, these findings indicate that the apical P2Y-IP3 receptor signaling complex is a dominant pathway mediating biliary epithelial Cl(-) transport and, therefore, may represent a potential target for increasing secretion in the treatment of cholestatic liver disease.


Figures

Fig. 1.
Fig. 1.
Characterization of whole cell ATP-stimulated currents. Exposure to ATP stimulates currents in human Mz-Cha-1 biliary epithelial cells. Whole cell currents were measured during basal conditions and during exposure to ATP (50 μM) (methods). A: representative whole cell recording. Currents measured at −80 mV (○), representing Iformula image, and at 0 mV (•), representing Iformula image, are shown. ATP exposure is indicated by the bar. A voltage-step protocol (test potentials between −100 mV and +100 mV in 20-mV increments) was obtained at a★ (basal) and b★ (maximal current response) as indicated. The current-voltage (I-V) plot shown in B was generated from these protocols. B: I-V relationship of whole cell currents during basal (○) and ATP-stimulated (•) conditions. C: representative ATP-stimulated whole cell current tracings measured at −80 mV in the absence of intracellular Ca2+ (EGTA 2 mM in pipette solution) or presence of Cl channel inhibitors. D: cumulative data demonstrating magnitude of ATP-stimulated currents in the presence or absence of the Cl channel inhibitors 5-nitro-2-(3-phenylpropylamino)-benzoic acid (NPPB; 100 μM), DIDS (100 μM), or CFTRinh-172 (5 μM) or removal of intracellular Ca2+ (EGTA in pipette). Values represent maximum current density (pA/pF) measured at −80 mV (n = 5–11 each). *ATP-stimulated currents were significantly inhibited (P < 0.05 for each).
Fig. 2.
Fig. 2.
ATP stimulates an increase in intracellular Ca2+ concentration ([Ca2+]i). Mz-ChA-1 cells grown on a coverglass were loaded with fura 2-AM, washed with PBS, and exposed to ATP (100 μM). Values represent an increase in the ratio of fluorescence at 340 and at 380. A: in this representative study, fura 2 fluorescence increased within seconds of ATP exposure (indicated by the bar) rapidly reaching a maximal value and then decreased to basal levels. Maximal and minimal Ca2+ fluorescence was obtained by exposure to ionomycin (2 μM) and EGTA (10 mM), respectively. B: representative study demonstrating ATP-stimulated fura 2 fluorescence after removal of extracellular Ca2+ (EGTA). C: representative study demonstrating ATP-stimulated fura 2 fluorescence after depletion of intracellular Ca2+ stores (thapsigargin 200 nM × 12 min). D: cumulative data demonstrating maximum [Ca2+]i (nM) for ATP alone (n = 12), ATP in presence of EGTA (n = 5), or ATP following previous exposure to thapsigargin (n = 7). *Preincubation with thapsigargin significantly inhibited ATP-stimulated [Ca2+]i (P < 0.005).
Fig. 3.
Fig. 3.
Agonist profile of nucleotide-stimulated intracellular Ca2+ fluorescence and Cl currents. A and B: representative Ca2+ fluorescence in fura 2-loaded cells. Maximal and minimal Ca2+ fluorescence was obtained by exposure to ionomycin (2 μM) and EGTA (10 mM), respectively. C and D: representative whole cell current tracings measured at −80 mV performed according to the protocol described in Fig. 1A. Fura 2 fluorescence increases rapidly in response to UTP (100 μM). B: benzoyl-benzoyl ATP (Bz-ATP; 100 μM) resulted in only a small increase in fura 2 fluorescence. C: UTP (50 μM) (indicated by the bar) activates currents that were reversibly inhibited by the Cl channel blocker NPPB (100 μM). D: Bz-ATP (50 μM) activated currents of low amplitude that were partially inhibited by NPPB (100 μM).
Fig. 4.
Fig. 4.
Effect of P2 receptor antagonists on ATP-stimulated intracellular [Ca2+] and Cl currents. AC: representative Ca2+ fluorescence in fura 2-loaded cells. In each representative sample, cells were exposed to ATP (100 μM) as indicated by the bar. Maximal and minimal Ca2+ fluorescence was obtained by exposure to ionomycin (2 μM) and EGTA (10 mM), respectively. DF: representative whole cell current tracings (pA) measured at −80 mV performed according to the protocol described in Fig. 1 after exposure to ATP (50 μM). AC: effect of the P2Y receptor antagonists suramin (100 μM) (A) and reactive blue 2 (RB-2, 25 μM) (B), or the P2X receptor antagonist brilliant blue G (BBG, 10 μM) (C) on fura 2 fluorescence. DF: representative whole cell patch clamp recordings of ATP-stimulated currents are shown in the presence of suramin (D), reactive blue 2 (E), or brilliant blue G (F).
Fig. 5.
Fig. 5.
Effect of pharmacological inhibition of PLC or inositol 1,4,5-triphosphate (IP3) receptors on ATP-stimulated changes in [Ca2+]i. Cells were loaded with fura 2-AM, according to the protocol described in Fig. 2, and exposed to ATP (100 μM) in the presence or absence of PLC or IP3 receptor inhibitors (methods). Values represent an increase in the ratio of fluorescence at 340 and at 380. Maximal and minimal Ca2+ fluorescence was obtained by exposure to ionomycin (2 μM) and EGTA (10 mM), respectively. A: effect of the inactive analog U73343 (10 μM) on fura 2 fluorescence. B: effect of the PLC inhibitor U73122 (10 μM) on fura 2 fluorescence. C: effect of the IP3 receptor inhibitor 2-APB (100 μM) on fura 2 fluorescence. D: cumulative data demonstrating effect of PLC or IP3 receptor inhibition on ATP-stimulated intracellular [Ca2+]i. *U73122 (n = 9) or 2-APB (n = 4) significantly inhibited (P < 0.05 for each) ATP-stimulated increases in [Ca2+]i.
Fig. 6.
Fig. 6.
Effect of pharmacological inhibition of PLC or IP3 receptors on ATP-stimulated Cl currents. Whole cell patch clamp studies were performed according to the protocol described in Fig. 1. AC: representative whole cell patch clamp recordings of ATP-stimulated (50 μM) currents in the presence of U73343 (10 μM) (A), U73122 (10 μM) (B), or 2-APB (100 μM) (C). D: cumulative data demonstrating effects of PLC or IP3 inhibition on ATP-stimulated current density. *U73122 or 2-APB significantly (P < 0.001) inhibited ATP-stimulated currents. The inactive analog U73343 had no effect. Values represent maximum current density (pA/pF) measured at −80 mV (n = 4–9 each).
Fig. 7.
Fig. 7.
Intracellular dialysis with recombinant IP3 activates membrane Cl currents. Under whole cell patch clamp conditions (performed according to protocol described in Fig. 1), recombinant IP3 (20 μM) was delivered to the cell interior by inclusion in the patch pipette. A: in control cells (without IP3), no spontaneous currents are noted (top tracing). Dialysis with IP3 resulted in spontaneous activation of membrane currents as IP3 diffused into the cell interior (bottom tracing). NPPB inhibited membrane currents. A voltage-step protocol (test potentials between −100 mV and +100 mV in 20-mV increments) was obtained at times marked with ★ during both basal and maximal current responses and shown below the trace, respectively. The I-V plot shown in B was generated from these protocols. B: I-V relationship of whole cell currents during basal (○) and intracellular dialysis with IP3 (•). C: cumulative data demonstrating maximum current density (pA/pF) measured at −80 mV under basal conditions, in response to extracellular ATP (50 μM), or intracellular dialysis with IP3 (20 μM). *Extracellular ATP (n = 33) or intracellular IP3 (n = 4) significantly increased current density (P < 0.001 and P < 0.005 vs. basal, respectively).
Fig. 8.
Fig. 8.
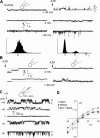
ATP exposure activates unitary Cl currents. A: single ion channel currents were measured in the cell-attached configuration. Currents are shown at the resting membrane potential (0 mV) and at pipette potentials [pipette voltages (Vp) as indicated]. An all-points amplitude histogram is shown for Vp +40 mV. Under basal conditions few spontaneous openings were measured (C = closed level), left. Exposure to ATP (50 μM) caused rapid appearance of channels carrying outward membrane currents (at Vp +40 mV), right. The presence of 2 open levels (O1 and O2) in each patch was characteristic. B: replacement of the monovalent cations (Na+, K+) in the patch pipette with tetraethylammonium (TEA) did not affect mean open probability (NPo) in response to ATP (NPo 0.66 ± 0.1) shown at left, whereas inclusion of the Cl channel blocker NPPB significantly inhibited ATP-stimulated currents (NPo 0.13 ± 0.1) shown at right. C: representative current trace showing single-channel events at different voltages (indicated at left of each trace) in presence of high K+ (KCl 140 mM) and simultaneous inclusion of Ba2+ (BaCl2 5 mM), in bath and pipette solution. Open (O) and closed (C) states are represented by dotted lines. D: effect of cation substitution on the single-channel current-voltage relation of the cell-attached patch recordings. Currents were recorded with standard NaCl containing buffer (○), replacement of monovalent cations with TEA (•) or with high-K+ and -Ba2+ solutions (▵). Replacement of monovalent cations with TEA did not affect membrane currents, whereas the high-K+ solutions resulted in a shift in reversal to 0 mV (ECl−). Each point represents the mean ± SE connected by polynomial fit. The dotted line represents the linear best-fit at the positive potentials recorded with standard extracellular and pipette solutions. The single-channel conductance was calculated from this slope.
Fig. 9.
Fig. 9.
ATP increases transepithelial Cl secretion in polarized biliary monolayers. Short-circuit current (Isc) across normal rat cholangiocyte (NRC) monolayers was measured under voltage-clamp conditions in an Ussing chamber. In these representative recordings agonists are added to the apical chamber. A: simultaneous addition of cpt-cAMP (500 μM) and 3-isobutyl-1-methylxanthine (IBMX, 100 μM) increased Isc, and subsequent addition of ATP (100 μM) resulted in a further significant increase in the magnitude of the Isc (top tracing). In the presence of CFTRinh-172 (5 μM) cpt-cAMP-IBMX failed to increase Isc; however, the ATP-stimulated increase in Isc was unaffected (bottom tracing). B: cumulative data showing the average change in Isc after addition of cpt-cAMP-IBMX or ATP in the presence or absence of CFTRinh-172. The y-axis values are reported as ΔIsc (maximum Isc − basal Isc). *CFTRinh-172 significantly inhibited the cpt-cAMP-IBMX-induced increase in Isc (P < 0.01, n = 4 each) **Extracellular ATP added to the apical chamber significantly increased Isc vs. cpt-cAMP-IBMX (P < 0.05, n = 4). C: in this representative recording, addition of ATP (100 μM) to the apical bath increases Isc (top tracing). In the presence of U73122, the ATP-stimulated Isc is inhibited. D: cumulative data demonstrating the average change in ATP-stimulated Isc in the presence of suramin, U73122, or 2-APB. The y-axis values are reported as ΔIsc (maximum Isc − basal Isc). *Suramin (n = 4, P < 0.05), U73122 (n = 7, P < 0.01), or 2-APB (n = 6, P < 0.05) each significantly inhibited the ATP-stimulated increase in Isc.

Similar articles

Cited by

References

    1. Abbracchio MP, Burnstock G, Boeynaems JM, Barnard EA, Boyer JL, Kennedy C, Knight GE, Fumagalli M, Gachet C, Jacobson KA, Weisman GA. International Union of Pharmacology LVIII: update on the P2Y G protein-coupled nucleotide receptors: from molecular mechanisms and pathophysiology to therapy. Pharmacol Rev 58: 281–341, 2006. - PMC - PubMed
    1. Alpini G, Roberts S, Kuntz SM, Ueno Y, Gubba S, Podila PV, Lesage G, LaRusso NF. Morphological, molecular, and functional heterogeneity of cholangiocytes from normal rat liver. Gastroenterology 110: 1636–1643, 1996. - PubMed
    1. Bai D, del Corsso C, Srinivas M, Spray DC. Block of specific gap junction channel subtypes by 2-aminoethoxydiphenyl borate (2-APB). J Pharmacol Exp Ther 319: 1452–1458, 2006. - PubMed
    1. Basavappa S, Middleton JP, Mangel A, McGill J, Cohn JA, Fitz JG. Cl− and K+ transport in human biliary cell lines. Gastroenterology 104: 1796–1805, 1993. - PubMed
    1. Buell G, Lewis C, Collo G, North RA, Surprenant A. An antagonist-insensitive P2X receptor expressed in epithelia and brain. EMBO J 15: 55–62, 1996. - PMC - PubMed

Publication types

LinkOut - more resources