. 2008 Oct;135(20):3355-67.
doi: 10.1242/dev.022830. Epub 2008 Sep 11.

odd skipped related1 reveals a novel role for endoderm in regulating kidney versus vascular cell fate

Affiliations

odd skipped related1 reveals a novel role for endoderm in regulating kidney versus vascular cell fate

Sudha P Mudumana et al. Development. 2008 Oct.

Abstract

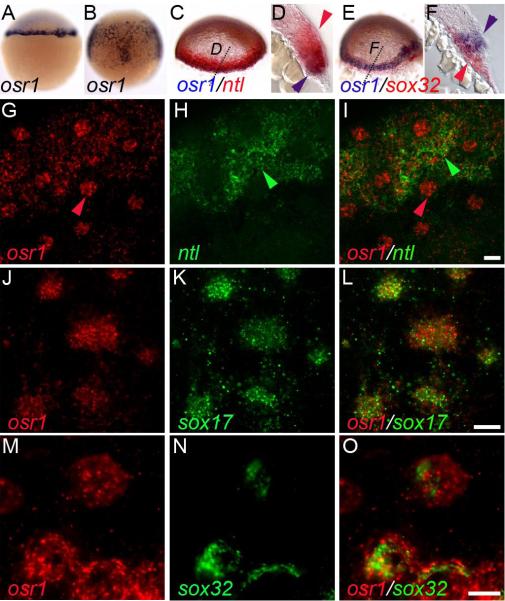
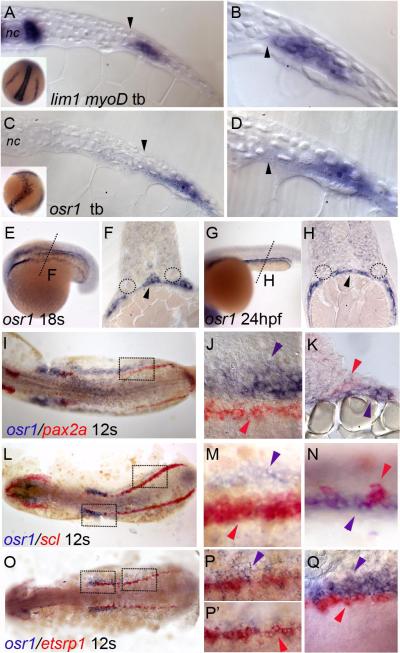
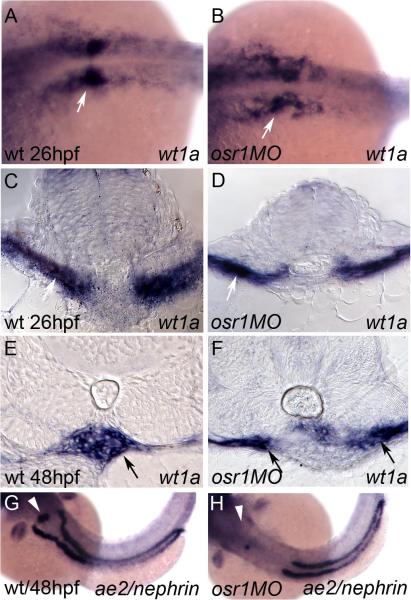
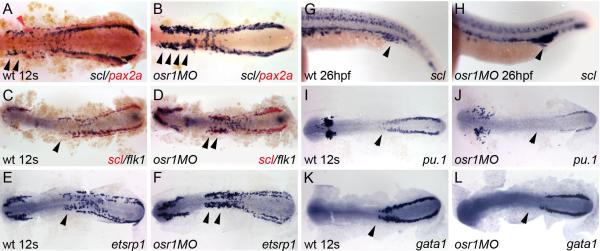
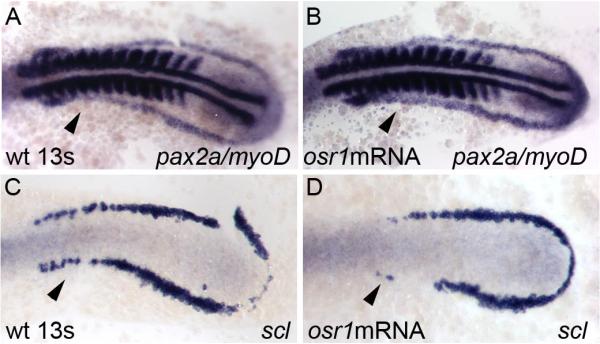
The kidney and vasculature are intimately linked both functionally and during development, when nephric and blood/vascular progenitor cells occupy adjacent bands of mesoderm in zebrafish and frog embryos. Developmental mechanisms that underlie the differentiation of kidney versus blood/vascular lineages remain unknown. The odd skipped related1 (osr1) gene encodes a zinc-finger transcription factor that is expressed in the germ ring mesendoderm and subsequently in the endoderm and intermediate mesoderm, prior to the expression of definitive kidney or blood/vascular markers. Knockdown of osr1 in zebrafish embryos resulted in a complete, segment-specific loss of anterior kidney progenitors and a compensatory increase in the number of angioblast cells in the same trunk region. Histology revealed a subsequent absence of kidney tubules, an enlarged cardinal vein and expansion of the posterior venous plexus. Altered kidney versus vascular development correlated with expanded endoderm development in osr1 knockdowns. Combined osr1 loss of function and blockade of endoderm development by knockdown of sox32/casanova rescued anterior kidney development. The results indicate that osr1 activity is required to limit endoderm differentiation from mesendoderm; in the absence of osr1, excess endoderm alters mesoderm differentiation, shifting the balance from kidney towards vascular development.


Figures

Figure 1
Figure 1. osr1 expression during early gastrulation
osr1 expression in the germ ring at 30% epiboly (A) and in the gastrulating cells at 75% epiboly (B). (C) Two color in situ of osr1 (blue) and ntl (red) mRNA transcripts at 30% epiboly. (D) Cross section of (C) at the level indicated shows that osr1 is not expressed in the ntl-positive mesodermal cells farther from the margin (red arrowhead) and restricted to mesendoderm cells closest to the margin (blue arrowhead). (E) Co-localization of osr1 (blue) and sox32 (red) mRNA transcripts at 30% epiboly. (F) Cross section of (E) at the level indicated shows osr1 expression in the mesendoderm cells with some overlap with sox32-positive endodermal cells (blue arrowhead) but absent from the sox32-positive YSL cells (red arrowhead). (G-I) Double fluorescent in situ hybridization of osr1 (red) and ntl (green) probes at 60% epiboly. The images represent a maximum intensity projection of a confocal z-series stack (4 slices, 1.9μm each). (I) merge of (G) and (H) showing distinct expression of osr1 (G) in endoderm cells (red arrowhead, G, I) that do not express ntl (H). osr1 (G) is co-expressed with ntl (H) in mesendoderm cells (green arrowhead, H, I). (J-L) Double fluorescent in situ hybridization of osr1 (red) and sox17 (green) at 60% epiboly. Images represent a single confocal slice of 1.9 μm. (L) merge of (J) and (L) showing co-expression of osr1 and sox17 in endoderm cells. (M-O) Double fluorescent in situ hybridization of osr1 (red) and sox32 (green) at 60% epiboly. Images represent a single confocal slice of 1.9 μm. (O) merge of (M) and (N) showing co-expression of osr1 and sox32 in endoderm cells. Scale bars in I, L, and O = 10μm.
Figure 2
Figure 2. osr1 expression during zebrafish development
(A) Cross section of a tailbud stage embryo showing expression of lim1 in cells of the IM (A, inset) adjacent to presomitic mesoderm (arrowhead) and myoD in adaxial cells adjacent to the notochord (nc,). (B) Magnification of A showing proximity of lim1 positive IM to the border of presomitic mesoderm (arrowhead). (C) Cross section of a tailbud stage embryo showing expression of osr1 in bilateral stripes (inset, C) in cells lateral and ventral to the expression of lim1 (C, D) (arrowheads mark the anatomical border of presomitic mesoderm. (E) At 18 somites osr1 is expressed in bilateral stripes just anterior to the somites and in lateral mesoderm of the trunk and tail. (F) Cross section of embryo in (E) at the level indicated by a dotted line in E showing osr1 expression ventral and lateral to the pronephros (dotted circles in F) and endodermal cells (arrowhead, F). (G) osr1 expression at 24 hpf in cells overlying the yolk extension. (H) Cross section of the embryo in (G) at the level indicated shows osr1 expression in the ventrolateral mesoderm distinct from the pronephric ducts (dotted circles) and in endoderm (arrowhead, H). (I-K) Expression of osr1 (blue) and pax2a (red). (J) Magnified views of boxed region in (I) show non-overlapping expression of osr1 (blue arrowhead) and pax2a (red arrowhead) in the intermediate mesoderm. (K) Cross section at the same level shows expression of osr1 (blue arrowhead) in cells ventral and lateral to the cells expressing pax2a (red arrowhead). (L-N) Expression of osr1 (blue) and scl (red) at 12 somites. Magnified views of boxed regions in (L) show non-overlapping expression of osr1 and scl in the posterior (M) and anterior (N) regions of the PLM. (O-Q) Expression of osr1 (blue) and etsrp1 (red) at 12 somites. Magnified views of boxed regions in (O) show non-overlapping expression of osr1 and etsrp1 in the posterior (P, P’) and anterior (Q) regions of the PLM. (P, P’) Magnified view of the boxed region in (O) at different focal planes showing osr1 and etsrp1 positive cells at different dorso-ventral positions with osr1 in more ventral (P) and etsrp1 in the more dorsal cells (P’) with reference to yolk cells.
Figure 3
Figure 3. osr1 knockdown results in segment-specific kidney defects
(A) osr1 gene structure and morpholino oligo targeting exon 2 (ex2d). (B) RTPCR analysis of morpholino-induced osr1 mis-splicing. Blocking the exon 2 splice donor sequence resulted in the complete deletion of exon 2, which contains the ATG start codon as well as the entire coding sequence for the osr1 transcriptional regulatory domain and the first zinc finger. In embryos injected with 7.4 ng morpholino, no wild-type mRNA was detectable at 24 hpf, indicating that these morphant embryos were functionally null for osr1. A 5-base pair mismatch control morpholino did not cause any molecular or phenotypic defects. Co-injection of osr1 synthetic mRNA along with the exon 2 donor morpholino rescued the osr1 phenotype in 53% (9/17) of embryos as determined by pax2a expression (see results), demonstrating specificity of the morpholino knockdown. (C) Expression of ae2 in the proximal pronephros (white arrowhead) is absent in osr1 morphants (D) while the distal pronephros is unaffected. Immunofluorescence using anti-NaK ATPase alpha6F monoclonal antibody labels the entire pronephros in wild type embryos (E) while expression is specifically lost in the proximal nephron of osr1 morphants (white arrowhead, F) while the distal pronephros was unaffected (red arrowhead, F) .
Figure 4
Figure 4. osr1 is required for glomerular morphogenesis
Expression of wt1a in control (A) and osr1 morphants (B) at 26 hpf. Histological cross-sections of the 26 hpf glomerular progenitors in wild-type (C) and osr1 morphants (D) shows equivalent expression of wt1a (arrows). Cross section of wild-type glomerulus at 48hpf (E) shows wt1a expression in the midline vascularized glomerulus (arrow) while in osr1 morphants (F) wt1a-positive podocytes remain in an immature state (arrows) and fail to coalesce to the midline. Expression of the podocyte marker nephrin is lost in osr1 morphants (arrowhead, H) when compared to the control embryos (arrowhead, G). Segment specific loss of ae2 expression in the proximal pronephros is evident in the osr1 morphants (H) when compared to controls (G) at 48 hpf.
Figure 5
Figure 5. osr1 knockdown expands vascular progenitor tissue
(A) scl (blue) and pax2a (red) expression in wild-type embryos labels adjacent bands of intermediate mesoderm in 12 somite stage wild-type embryos. (B) osr1 knockdown results in expansion of scl-positive tissue, most prominently in anterior LPM (black arrowheads) and loss of pax2a expressing cells. (C) flk1 (blue) and scl (red) expression in 12 somite wild-type embryos. (D) osr1 knockdown increases the number of flk1 expressing cells (arrowheads). (E) etsrp1 expression in control 12 somite embryos. (F) etsrp1 expression is expanded in 12 somite stage osr1 morphants (arrowheads). (G) At 26hpf, scl is expressed in the blood islands and forming veinous plexus (arrowhead). (H) 26hpf osr1 morphants show an expansion of scl-positive tissue in the region of the forming veinous plexus (arrowhead). Expression of the monocyte lineage marker pu.1 in wild-type embryos (I) and osr1 morphants (J) shows a reduction of expression in the anterior aspect of its LPM expression domain (arrow). Similarly, expression of the erythrocyte marker gata1 in wild-type embryos (K) and osr1 morphants (L) shows a reduction of expression in its most anterior expression domain (arrow).
Figure 6
Figure 6. Overexpression of osr1 causes expansion of pronephric progenitors and a reduction in angioblasts
Control (A, C) and embryos injected with 100pg of osr1 mRNA (B, D). (A) Control expression of pax2a is expanded after injection of osr1 mRNA (B), specifically in the mid portion of the IM (arrowhead, B) which is normally downregulated in the control embryos at the 13 somite stage (arrowhead, A). myoD is used as an internal control for somite staging in these embryos (A, B). (C, D) Expression of scl is lost in the anterior lateral plate mesoderm (arrowhead, D) in the embryos injected with osr1 mRNA when compared to the uninjected controls (arrowhead, C).
Figure 7
Figure 7. Loss of pronephric epithelial differentiation and vascular expansion in osr1 morphants
Control (A,C,E,G) and osr1 morphants (B,D,F,H) at 52hpf. (A) Wild-type 52hpf embryo showing position of histological sections in C and E. (B) osr1 morphant embryo showing position of histological sections in D and F. (C) Cross section at the level of the fin buds (C; inset) shows normal glomerular structure (arrowhead) and connecting pronephric tubules. (D) Cross section at the level of the fin buds in an osr1 morphant (D; inset) shows absence of pronephric tubules and glomerulus and expansion of cardinal vein (v). (E) In more posterior sections of wild-type embryos, the pronephric epithelial tubules (arrowhead) and cardinal vein (v) are of roughly similar dimensions. In osr1 morphants (F), pronephric tubules are reduced in diameter compared to wild-type (arrowhead) and the cardinal vein (v) is significantly expanded. Angiogram of wild-type embryo trunk and tail region (G) highlights the aorta (a) and the common tail vein (v). Angiogram of an osr1 morphant (H) highlights a grossly expanded veinous plexus in the tail (v). Intersomitic vessels were present in osr1 morphants but are not shown in the confocal sections used in this projection.
Figure 8
Figure 8. Ectopic expression of pax2a rescues intermediate mesoderm patterning in osr1 morphants
Expression of ae2 in the pronephros of 24 hpf control (A), osr1 morphant (B) and osr1 morphant coinjected with pax2a mRNA (C). Horizontal lines denote length of the wild-type, ae2-positive proximal nephron segment. Expression of scl in the anterior lateral mesoderm of 24 hpf control (D), osr1 morphant (E) and osr1 morphant coinjected with pax2a mRNA (F). Horizontal lines denote length of the wild-type, scl-positive anterior lateral mesoderm. (G) Quantification of pax2a rescue of ae2-positive proximal pronephric nephron cells (see text for details).
Figure 9
Figure 9. osr1 knockdown does not affect specification of pronephric and angioblast mesoderm but their subsequent maintenance
Expression of pax2a and myoD in control (A) and osr1 morphants (B) is similar at 5 somites (arrowheads in A and B). myoD is used as a internal somite staging control. Expression of pax2a in 14 somite control (C) and osr1 morphants (D) reveals a substantial reduction in pax2a positive cells in the anterior IM (arrowheads, C, D). Expression of pax2a in 24 hpf control (E) and osr1 morphants (F) shows a complete loss of pax2a positive cells in the proximal pronephros (arrowheads, E, F). Expression of scl in osr1 morphants (H) is similar to that of control embryos at 8 somites (G). However, by the 14 somite stage, the number of scl-expressing cells is significantly upregulated in the anterior lateral plate mesoderm of osr1 morphants (arrowhead, J) when compared to control embryos at the same stage (arrowhead, I).
Figure 10
Figure 10. osr1 knockdown causes expansion of endoderm
(A-F) Expression of endoderm marker, sox17 in control (A-C) and osr1 morphants (D-F) at the shield stage. (A, D) dorsal views; (B, E) side views with dorsal facing; (C) and (F) are magnified views of boxed regions in (B) and (E) respectively. The number of tiers of sox17-expressing cells was significantly increased in osr1 morphants at the blastoderm margin (C, bar, E) and in the ventral region of the embryo (arrowhead, D) when compared to control (A, C and bar, B). (G-L) Expression of mesendoderm marker, foxa2 in control (G-I) and osr1 morphants (J-L) at the shield stage. (G, J) dorsal views; (H, K) side views with dorsal facing; (I) and (L) are magnified views of boxed regions in (H) and (K) respectively. The number of tiers of foxa2-expressing cells were significantly increased in osr1 morphants with more layers of foxa2-expressing cells at the blastoderm margin (L, bar, K) and enhanced expression in the ventral region of the embryo (arrowhead, J) when compared to control (G, I and bar, H). (M-O). Expression of foxa2 at 18 somites in controls (M), osr1 morphants (N) and sox32 (cas) morphants (O). Development of foxa2-positive pharyngeal endoderm was enhanced in osr1 morphants (arrowheads, N) when compared to control embryos (arrowheads, M) and was completely blocked by sox32 knockdown (arrowheads, O).
Figure 11
Figure 11. Elimination of endoderm development in osr1 morphants rescues proximal pronephric phenotype
Expression of pax2a in control (A), osr1 morphant (B), sox32 morphant (C) and osr1+sox32 double morphants (D). Loss of osr1 resulted in loss of proximal pax2a pronephric expression (arrowhead, B) when compared to control 18 somite stage embryos (arrowhead, A). sox32(cas) morphants lacking endoderm showed slightly enhanced expression of pax2a in the proximal nephron (arrowhead, C). The loss of pax2a expression in the proximal pronephros of osr1 morphants was rescued by elimination of endoderm in the osr1+ sox32 double morphants (arrowhead, D). Expression of pax2a in uninjected bon heterozygote incross embryos (E) and osr1 morpholino injected bon incross embryos (F, G) at 24hpf. pax2a expression was lost from the proximal pronephros in 47 out of 64 of the injected embryos (73%) (F). Loss of pax2a expression from the proximal pronephros was rescued in 17 out of 64 (27%) osr1 MO injected, bon heterozygote incross embryos.

Similar articles

Cited by

References

    1. Alexander J, Rothenberg M, Henry GL, Stainier DY. casanova plays an early and essential role in endoderm formation in zebrafish. Dev Biol. 1999;215:343–57. - PubMed
    1. Barrallo-Gimeno A, Holzschuh J, Driever W, Knapik EW. Neural crest survival and differentiation in zebrafish depends on mont blanc/tfap2a gene function. Development. 2004;131:1463–77. - PubMed
    1. Bisgrove BW, Raible DW, Walter V, Eisen JS, Grunwald DJ. Expression of c-ret in the zebrafish embryo: potential roles in motoneuronal development. J Neurobiol. 1997;33:749–68. - PubMed
    1. Bollig F, Mehringer R, Perner B, Hartung C, Schafer M, Schartl M, Volff JN, Winkler C, Englert C. Identification and comparative expression analysis of a second wt1 gene in zebrafish. Dev Dyn. 2006;235:554–61. - PubMed
    1. Bouchard M, Souabni A, Mandler M, Neubuser A, Busslinger M. Nephric lineage specification by Pax2 and Pax8. Genes Dev. 2002;16:2958–70. - PMC - PubMed

Publication types