. 2008 Nov;295(5):C1247-60.
doi: 10.1152/ajpcell.00083.2008. Epub 2008 Sep 11.

Oxidant-induced inhibition of the plasma membrane Ca2+-ATPase in pancreatic acinar cells: role of the mitochondria

Affiliations

Oxidant-induced inhibition of the plasma membrane Ca2+-ATPase in pancreatic acinar cells: role of the mitochondria

Erin M Baggaley et al. Am J Physiol Cell Physiol. 2008 Nov.

Abstract

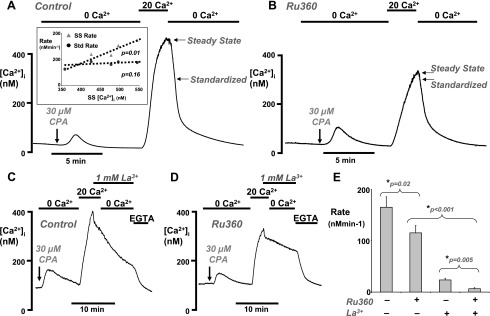
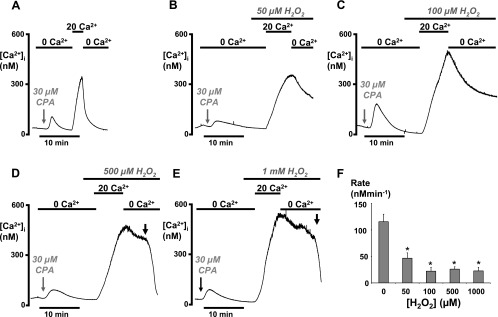
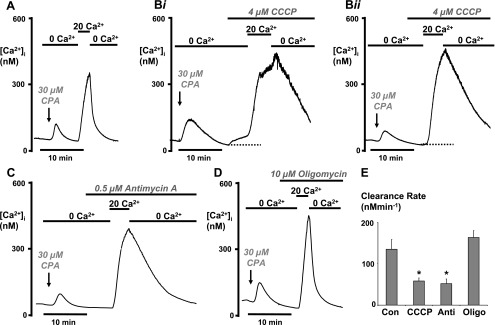
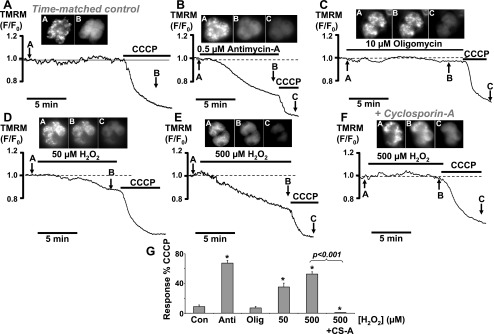
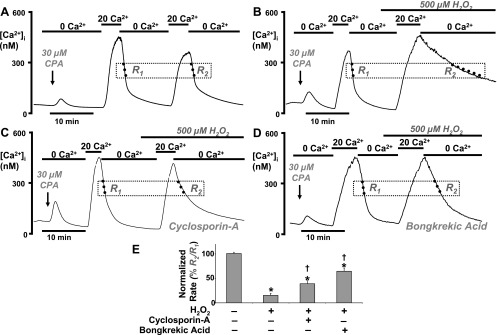
Impairment of the normal spatiotemporal pattern of intracellular Ca(2+) ([Ca(2+)](i)) signaling, and in particular, the transition to an irreversible "Ca(2+) overload" response, has been implicated in various pathophysiological states. In some diseases, including pancreatitis, oxidative stress has been suggested to mediate this Ca(2+) overload and the associated cell injury. We have previously demonstrated that oxidative stress with hydrogen peroxide (H(2)O(2)) evokes a Ca(2+) overload response and inhibition of plasma membrane Ca(2+)-ATPase (PMCA) in rat pancreatic acinar cells (Bruce JI and Elliott AC. Am J Physiol Cell Physiol 293: C938-C950, 2007). The aim of the present study was to further examine this oxidant-impaired inhibition of the PMCA, focusing on the role of the mitochondria. Using a [Ca(2+)](i) clearance assay in which mitochondrial Ca(2+) uptake was blocked with Ru-360, H(2)O(2) (50 microM-1 mM) markedly inhibited the PMCA activity. This H(2)O(2)-induced inhibition of the PMCA correlated with mitochondrial depolarization (assessed using tetramethylrhodamine methylester fluorescence) but could occur without significant ATP depletion (assessed using Magnesium Green fluorescence). The H(2)O(2)-induced PMCA inhibition was sensitive to the mitochondrial permeability transition pore (mPTP) inhibitors, cyclosporin-A and bongkrekic acid. These data suggest that oxidant-induced opening of the mPTP and mitochondrial depolarization may lead to an inhibition of the PMCA that is independent of mitochondrial Ca(2+) handling and ATP depletion, and we speculate that this may involve the release of a mitochondrial factor. Such a phenomenon may be responsible for the Ca(2+) overload response, and for the transition between apoptotic and necrotic cell death thought to be important in many disease states.


Figures

Fig. 1.
Fig. 1.
Validation of plasma membrane Ca2+-ATPase (PMCA) activity assay. A and B: representative traces showing the intracellular Ca2+ ([Ca2+]i) clearance assay (see results) in untreated fura-2-loaded pancreatic acinar cells (A) and cells treated with 10 μM Ru-360 for 30 min, to inhibit mitochondrial Ca2+ uptake (B). Cells were treated with 30 μM cyclopiazonic acid (CPA), as indicated by the arrow, in the absence of external Ca2+ (0 Ca2+) to deplete endoplasmic reticulum Ca2+. CPA was present in all solutions throughout the remainder of each experiment. [Ca2+]i clearance was initiated by the addition of 20 mM external Ca2+ (20 Ca2+), followed by the subsequent removal of external Ca2+ (0 Ca2+). Arrows represent the steady-state [Ca2+]i (see results) and the standardized [Ca2+]i (300 nM) from which the linear rate of [Ca2+]i clearance was measured (E). The inset in A represents the mean steady-state [Ca2+]i (SS [Ca2+]i) plotted against the mean linear clearance rate measured from the steady-state [Ca2+]i value (SS rate, gray triangles) or standardized 300 nM value (Std rate, black circles). There was a clear correlation between SS rate and SS [Ca2+]i (slope = 1.1 min−1, which was significantly different from zero; P = 0.01), but there was no such correlation between Std rate and SS [Ca2+]i (slope = 0.16 min−1, which was not significantly different from zero; P = 0.16). C and D: inhibition of PMCA activity with 1 mM La3+ in control (C) and Ru-360-treated cells (D). EGTA (1 mM) was used to remove the La3+ and restore PMCA activity. E: mean standardized linear [Ca2+]i clearance rate in untreated control cells (shown in A), compared with Ru-360-treated cells with or without La3+ (*statistical significance as assessed using an unpaired t-test).
Fig. 2.
Fig. 2.
H2O2 (50–1,000 μM) inhibited PMCA activity under conditions in which mitochondrial Ca2+ uptake was inhibited. Pancreatic acinar cells were pretreated with 10 μM Ru-360 for 30 min, to inhibit mitochondrial Ca2+ uptake, immediately before the start of the [Ca2+]i clearance assay in all experiments. H2O2 was added 2–5 min before the addition of 20 mM external Ca2+. Representative traces show control cells (A) and the effects of 50 μM (B), 100 μM (C), 500 μM (D), and 1 mM (E) H2O2. Gray arrows indicate the point at which CPA was added, which was then present throughout the experiment. Black arrows in D and E show rapid loss of dye due to cell lysis. F: mean data showing the standardized linear [Ca2+]i clearance rate following treatment with varying concentrations of H2O2 (*P < 0.001, as assessed using an unpaired t-test).
Fig. 3.
Fig. 3.
Antimycin-A and CCCP, but not oligomycin, inhibited PMCA activity. As in Figs. 1 and 2, cells were pretreated with Ru-360 (10 μM for 30 min) to inhibit mitochondrial Ca2+ uptake in all experiments. Representative traces show control cells (A) and the effects of 4 μM CCCP (Bi and Bii), 0.5 μM antimycin-A (C), and 10 μM oligomycin (D). Arrows indicate the point at which CPA was added, which was then present throughout the experiment. In 60% of cells, CCCP evoked an increase in [Ca2+]i when added in the absence of external Ca2+ (Bi) but had no effect in the remaining 40% of cells (Bii). E: mean data showing the standardized linear [Ca2+]i clearance rate following treatment with each mitochondrial inhibitor (*P < 0.05, as assessed using an unpaired t-test). Con, control; Anti, antimycin; Oligo, oligomycin.
Fig. 4.
Fig. 4.
Effects of H2O2, CCCP, antimycin, and oligomycin on ATP depletion (ATP-dep). Pancreatic acinar cells were loaded with 4 μM Magnesium Green (MgGreen) for 30 min at room temperature to indirectly measure cytosolic ATP concentration. Representative traces show the relative MgGreen fluorescence (F/F0; arbitrary units) in response to the “ATP depletion” cocktail with (gray trace) or without (black trace) preincubation with 10 μM BAPTA (A), 50 μM H2O2 (B), 500 μM H2O2 (C), 4 μM CCCP (D), 0.5 μM antimycin (E), and 10 μM oligomycin (F). The ATP depletion cocktail consisted of 100 μM carbachol (CCh), 10 μM oligomycin, and 2 mM iodoacetate and was used as a positive control to induce maximum ATP depletion. Cells that exhibited a rapid increase followed by a rapid decrease below the baseline fluorescence (see inset in A) were excluded from analysis because these likely represented cells undergoing cell lysis. Vertical bar represents 0.3 F/F0 and horizontal bar represents 5 min. G: mean data were quantified and normalized by expressing the change in F/F0 as a percentage of the ATP depletion cocktail response (*P < 0.05, as assessed using a one-sample t-test).
Fig. 5.
Fig. 5.
Effects of mitochondrial inhibitors and H2O2 on the mitochondrial membrane potential (ΔΨm). Representative traces show the relative tetramethylrhodamine methylester (TMRM) fluorescence (F/F0; arbitrary units) and corresponding TMRM fluorescent images of time-matched control (A) and cells treated with 0.5 μM antimycin-A (B), 10 μM oligomycin (C), 50 μM H2O2 (D), 500 μM H2O2 (E), and 500 μM H2O2 in the presence of 5 μM cyclosporin (F). A decrease in relative TMRM fluorescence represents mitochondrial depolarization. Inset images in AC were taken at the corresponding points on the trace as indicated by the arrows. Image A from each experiment indicates a punctate TMRM fluorescence distribution consistent with mitochondrial staining, from which fluorescence changes were measured. In each experiment, 4 μM CCCP was used as a positive control to evoke maximum mitochondrial depolarization. G: mean data were quantified and normalized by expressing the change in F/F0 as a percentage of the CCCP response (*P < 0.05, as assessed using a Mann-Whitney test). CS-A, cyclosporin-A.
Fig. 6.
Fig. 6.
Inhibition of the mitochondrial permeability transition pore partially protects the H2O2 induced inhibition of the PMCA. Representative traces show a paired experimental design whereby two repetitive [Ca2+]i clearance phases (R1 and R2) were invoked by successive application of 20 mM (20 Ca2+) and zero external Ca2+ (0 Ca2+). A: a time-matched control. B: effect of 500 μM H2O2 applied during the second clearance phase (R2). C: combined effect of 500 μM H2O2 and 5 μM cyclosporin-A (applied at the same time as CPA and throughout the experiment). D: effect of 500 μM H2O2 following preincubation with 50 μM bongkrekic acid for 30 min. E: mean data were quantified and normalized by expressing the linear rate (standardized at 300 nM Ca2+) during the second clearance phase as a percentage of the linear rate during the first clearance phase (R2/R1 × 100%). *P < 0.05, statistical significance as assessed using a paired one-sample t-test; †P < 0.05, statistical significance as assessed using a Mann-Whitney test.

Similar articles

Cited by

References

    1. Baggaley E, McLarnon S, Demeter I, Varga G, Bruce JI. Differential regulation of the apical plasma membrane Ca2+-ATPase by protein kinase A in parotid acinar cells. J Biol Chem 282: 37678–37693, 2007. - PubMed
    1. Baines CP, Kaiser RA, Purcell NH, Blair NS, Osinska H, Hambleton MA, Brunskill EW, Sayen MR, Gottlieb RA, Dorn GW, Robbins J, Molkentin JD. Loss of cyclophilin D reveals a critical role for mitochondrial permeability transition in cell death. Nature 434: 658–662, 2005. - PubMed
    1. Barros LF, Kanaseki T, Sabirov R, Morishima S, Castro J, Bittner CX, Maeno E, Ando-Akatsuka Y, Okada Y. Apoptotic and necrotic blebs in epithelial cells display similar neck diameters but different kinase dependency. Cell Death Differ 10: 687–697, 2003. - PubMed
    1. Barrow SL, Voronina SG, da Silva Xavier G, Chvanov MA, Longbottom RE, Gerasimenko OV, Petersen OH, Rutter GA, Tepikin AV. ATP depletion inhibits Ca2+ release, influx and extrusion in pancreatic acinar cells but not pathological Ca2+ responses induced by bile. Pflügers Arch 455: 1025–1039, 2008. - PubMed
    1. Bautista DM, Hoth M, Lewis RS. Enhancement of calcium signalling dynamics and stability by delayed modulation of the plasma-membrane calcium-ATPase in human T cells. J Physiol 541: 877–894, 2002. - PMC - PubMed

Publication types

MeSH terms

LinkOut - more resources