

Genome-wide relationship between histone H3 lysine 4 mono- and tri-methylation and transcription factor binding
- PMID: 18787082
- PMCID: PMC2593584
- DOI: 10.1101/gr.078519.108
Genome-wide relationship between histone H3 lysine 4 mono- and tri-methylation and transcription factor binding
Abstract
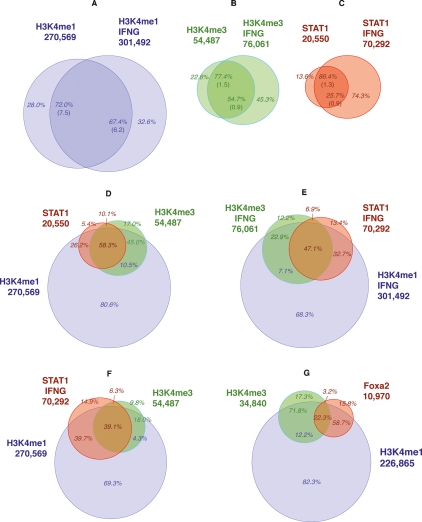
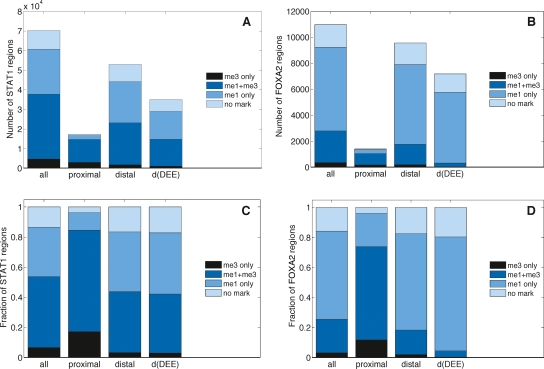
We characterized the relationship of H3K4me1 and H3K4me3 at distal and proximal regulatory elements by comparing ChIP-seq profiles for these histone modifications and for two functionally different transcription factors: STAT1 in the immortalized HeLa S3 cell line, with and without interferon-gamma (IFNG) stimulation; and FOXA2 in mouse adult liver tissue. In unstimulated and stimulated HeLa cells, respectively, we determined approximately 270,000 and approximately 301,000 H3K4me1-enriched regions, and approximately 54,500 and approximately 76,100 H3K4me3-enriched regions. In mouse adult liver, we determined approximately 227,000 and approximately 34,800 H3K4me1 and H3K4me3 regions. Seventy-five percent of the approximately 70,300 STAT1 binding sites in stimulated HeLa cells and 87% of the approximately 11,000 FOXA2 sites in mouse liver were distal to known gene TSS; in both cell types, approximately 83% of these distal sites were associated with at least one of the two histone modifications, and H3K4me1 was associated with over 96% of marked distal sites. After filtering against predicted transcription start sites, 50% of approximately 26,800 marked distal IFNG-stimulated STAT1 binding sites, but 95% of approximately 5800 marked distal FOXA2 sites, were associated with H3K4me1 only. Results for HeLa cells generated additional insights into transcriptional regulation involving STAT1. STAT1 binding was associated with 25% of all H3K4me1 regions in stimulated HeLa cells, suggesting that a single transcription factor can interact with an unexpectedly large fraction of regulatory regions. Strikingly, for a large majority of the locations of stimulated STAT1 binding, the dominant H3K4me1/me3 combinations were established before activation, suggesting mechanisms independent of IFNG stimulation and high-affinity STAT1 binding.
Figures
Similar articles
-
Identification of cis regulatory features in the embryonic zebrafish genome through large-scale profiling of H3K4me1 and H3K4me3 binding sites.Dev Biol. 2011 Sep 15;357(2):450-62. doi: 10.1016/j.ydbio.2011.03.007. Epub 2011 Mar 22. Dev Biol. 2011. PMID: 21435340 Free PMC article.
-
Locus co-occupancy, nucleosome positioning, and H3K4me1 regulate the functionality of FOXA2-, HNF4A-, and PDX1-bound loci in islets and liver.Genome Res. 2010 Aug;20(8):1037-51. doi: 10.1101/gr.104356.109. Epub 2010 Jun 15. Genome Res. 2010. PMID: 20551221 Free PMC article.
-
Clustered ChIP-Seq-defined transcription factor binding sites and histone modifications map distinct classes of regulatory elements.BMC Biol. 2011 Nov 24;9:80. doi: 10.1186/1741-7007-9-80. BMC Biol. 2011. PMID: 22115494 Free PMC article.
-
Enhancer biology and enhanceropathies.Nat Struct Mol Biol. 2014 Mar;21(3):210-9. doi: 10.1038/nsmb.2784. Nat Struct Mol Biol. 2014. PMID: 24599251 Review.
-
ChIPping away at gene regulation.EMBO Rep. 2008 Apr;9(4):337-43. doi: 10.1038/embor.2008.44. EMBO Rep. 2008. PMID: 18379585 Free PMC article. Review.
Cited by
-
Regulation of cyclooxygenase-2 expression by heat: a novel aspect of heat shock factor 1 function in human cells.PLoS One. 2012;7(2):e31304. doi: 10.1371/journal.pone.0031304. Epub 2012 Feb 8. PLoS One. 2012. PMID: 22347460 Free PMC article.
-
Multiplexed massively parallel SELEX for characterization of human transcription factor binding specificities.Genome Res. 2010 Jun;20(6):861-73. doi: 10.1101/gr.100552.109. Epub 2010 Apr 8. Genome Res. 2010. PMID: 20378718 Free PMC article.
-
Whole-genome cancer analysis as an approach to deeper understanding of tumour biology.Br J Cancer. 2010 Jan 19;102(2):243-8. doi: 10.1038/sj.bjc.6605497. Epub 2009 Dec 22. Br J Cancer. 2010. PMID: 20029419 Free PMC article.
-
Distinct global shifts in genomic binding profiles of limb malformation-associated HOXD13 mutations.Genome Res. 2013 Dec;23(12):2091-102. doi: 10.1101/gr.157610.113. Epub 2013 Aug 30. Genome Res. 2013. PMID: 23995701 Free PMC article.
-
Global epigenomic analysis of primary human pancreatic islets provides insights into type 2 diabetes susceptibility loci.Cell Metab. 2010 Nov 3;12(5):443-55. doi: 10.1016/j.cmet.2010.09.012. Cell Metab. 2010. PMID: 21035756 Free PMC article.
References
-
- Agger K., Christensen J., Cloos P.A., Helin K. The emerging functions of histone demethylases. Curr. Opin. Genet. Dev. 2008;18:159–168. - PubMed
-
- Arnosti D.N., Kulkarni M.M. Transcriptional enhancers: Intelligent enhanceosomes or flexible billboards? J. Cell. Biochem. 2005;94:890–898. - PubMed
-
- Barski A., Cuddapah S., Cui K., Roh T.Y., Schones D.E., Wang Z., Wei G., Chepelev I., Zhao K. High-resolution profiling of histone methylations in the human genome. Cell. 2007;129:823–837. - PubMed
-
- Benevolenskaya E.V. Histone H3K4 demethylases are essential in development and differentiation. Biochem. Cell Biol. 2007;85:435–443. - PubMed
Publication types
MeSH terms
Substances
LinkOut - more resources
Full Text Sources
Molecular Biology Databases
Research Materials
Miscellaneous