. 2008 Oct;18(10):1610-23.
doi: 10.1101/gr.076075.108. Epub 2008 Sep 11.

Reconstruction of the genome origins and evolution of the hybrid lager yeast Saccharomyces pastorianus

Affiliations

Reconstruction of the genome origins and evolution of the hybrid lager yeast Saccharomyces pastorianus

Barbara Dunn et al. Genome Res. 2008 Oct.

Abstract

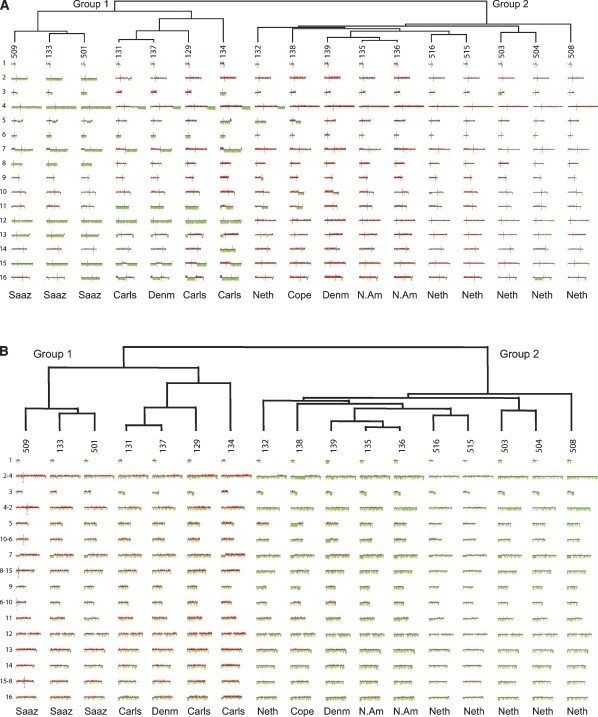
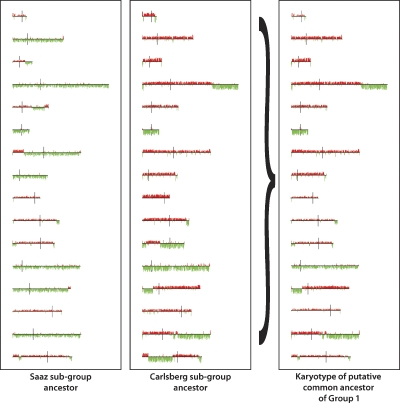
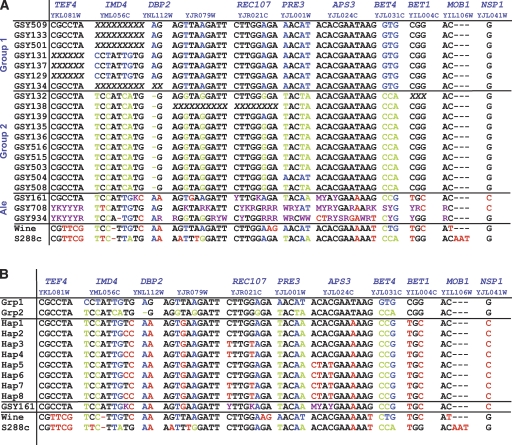
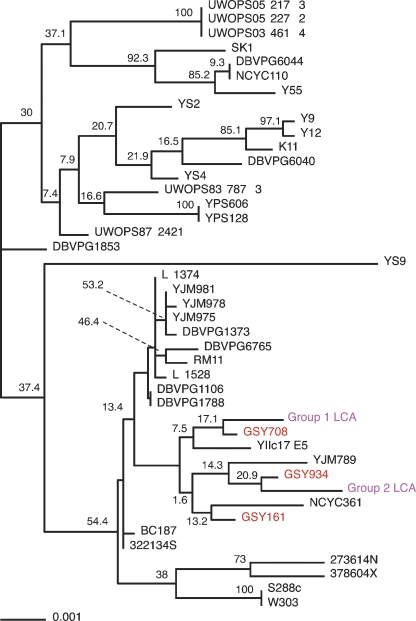
Inter-specific hybridization leading to abrupt speciation is a well-known, common mechanism in angiosperm evolution; only recently, however, have similar hybridization and speciation mechanisms been documented to occur frequently among the closely related group of sensu stricto Saccharomyces yeasts. The economically important lager beer yeast Saccharomyces pastorianus is such a hybrid, formed by the union of Saccharomyces cerevisiae and Saccharomyces bayanus-related yeasts; efforts to understand its complex genome, searching for both biological and brewing-related insights, have been underway since its hybrid nature was first discovered. It had been generally thought that a single hybridization event resulted in a unique S. pastorianus species, but it has been recently postulated that there have been two or more hybridization events. Here, we show that there may have been two independent origins of S. pastorianus strains, and that each independent group--defined by characteristic genome rearrangements, copy number variations, ploidy differences, and DNA sequence polymorphisms--is correlated with specific breweries and/or geographic locations. Finally, by reconstructing common ancestral genomes via array-CGH data analysis and by comparing representative DNA sequences of the S. pastorianus strains with those of many different S. cerevisiae isolates, we have determined that the most likely S. cerevisiae ancestral parent for each of the independent S. pastorianus groups was an ale yeast, with different, but closely related ale strains contributing to each group's parentage.


Figures

Figure 1.
Figure 1.
Array CGH of the S. cerevisiae and S. bayanus genome portions of 17 S. pastorianus strains. (A) Array CGH of the S. cerevisiae genomes. Array CGH data for the S. cerevisiae chromosomes of the S. pastorianus strains are shown in numerical order with chromosome I at the top and chromosome XVI at the bottom. Regions that are strongly green represent loss of that portion of the S. cerevisiae genome; regions that are strongly red represent regions of the S. cerevisiae genome that are amplified; and regions that are neither strongly green nor strongly red have a normal complement of the S. cerevisiae genomic content for that region. (B) Array CGH of the S. bayanus genomes. Array CGH data for the S. bayanus chromosomes of the examined strains are shown in a manner identical to that described in A; note that the three pairs of S. bayanus chromosomes that have experienced reciprocal translocations relative to the S. cerevisiae genome are shown as they exist in S. bayanus, that is, in their translocated form. For these six chromosomes, the translocation breakpoint is shown (for GSY509 only, but are the same for all strains) as a blue vertical line. In every case for the translocated chromosomes, the number of the chromosome is such that the chromosome to the left of the breakpoint is listed first in the name (e.g., chromosome 2-4 has the chromosome homologous to the S. cerevisiae chromosome II to the left side of the blue vertical line, and has the homologous chromosome IV to the right side of the vertical line). For the translocated chromosomes, centromeres are shown as shorter black vertical lines; for all nontranslocated chromosomes, the centromeres are in the same location as for the S. cerevisiae chromosomes in A.
Figure 2.
Figure 2.
Reconstruction of the ancestral karyotypic lineages of the S. cerevisiae portion of the S. pastorianus genome. By examining the karyotypes of the two strains that share the furthest divergence point within Group 1, and assuming that S. cerevisiae DNA sequences can only be lost, not gained de novo, each S. cerevisiae chromosome of the putative shared ancestor can be reconstructed as the merging of all S. cerevisiae segments present in both strains, using the iterative process described in Methods. This figure shows the reconstructed ancestors for the two subgroups within the Group 1 S. pastorianus strains on the left, and the final reconstructed ancestor for the entire Group 1 on the right. Applying this logic to Group 2, the reconstructed ancestor for Group 2 is an organism with a complete S. cerevisiae genome (data not shown).
Figure 3.
Figure 3.
(A) Sequence differences between the Group 1 and Group 2 S. pastorianus strains (S. cerevisiae genomic portion only). Only nucleotides showing differences among the sequenced strains are shown. The five different gene regions sequenced are shown along the top; the primers used for both PCR and sequencing are given in Supplemental Table S1. Nucleotides in blue and green are those that distinguish Group 1 from Group 2 strains; nucleotides in red are those that are not shared with either Group 1 or Group 2 strains, and nucleotides in purple are those that are heterozygous in the ale strains, as determined from manual inspection of the sequence traces. Where a gene is not present in the genome because of deletion of that region of the S. cerevisiae genomic portion, the sequences are shown as a series of “X”s. Note that all of the heterozygous nucleotides or regions seen in the ale strains can yield (in at least one configuration) nucleotides consistent with the corresponding residues in the lager strains (either Group 1, Group 2, or both). (B) Sequences of the ale haplotypes inferred from spores of GYS161. As described, the ale strain GSY161 was sporulated and seven spores were sequenced across the 11 loci shown in the figure. For each unlinked locus with heterozygosities in the parent strain, unambiguous haplotypes were derived. Because there are three heterozygous loci, eight haplotypes can be inferred; all eight are shown in this figure with the one most similar to the Group 1 and Group 2 lager strains shown at the top of the list (“Hap1”).
Figure 4.
Figure 4.
Phylogenetic tree, estimated using parsimony, of sequenced loci across a large number of S. cerevisiae strains. Sequence data from the deduced last common ancestors of Groups 1 and 2 (magenta) were aligned with sequence data from three ale strains (red) and 37 other sequenced S. cerevisiae strains. Bootstrap values are shown. An unrooted version of this tree is available in Supplemental Figure 4.

Similar articles

Cited by

References

    1. Altschul S.F., Gish W., Miller W., Myers E.W., Lipman D.J., Gish W., Miller W., Myers E.W., Lipman D.J., Miller W., Myers E.W., Lipman D.J., Myers E.W., Lipman D.J., Lipman D.J. Basic local alignment search tool. J. Mol. Biol. 1990;215:403–410. - PubMed
    1. Awad I.A., Rees C.A., Hernandez-Boussard T., Ball C.A., Sherlock G., Rees C.A., Hernandez-Boussard T., Ball C.A., Sherlock G., Hernandez-Boussard T., Ball C.A., Sherlock G., Ball C.A., Sherlock G., Sherlock G. Caryoscope: An Open Source Java application for viewing microarray data in a genomic context. BMC Bioinformatics. 2004;5:151. doi: 10.1186/1471-2105-5-151. - DOI - PMC - PubMed
    1. Bond U., Neal C., Donnelly D., James T.C., Neal C., Donnelly D., James T.C., Donnelly D., James T.C., James T.C. Aneuploidy and copy number breakpoints in the genome of lager yeasts mapped by microarray hybridisation. Curr. Genet. 2004;45:360–370. - PubMed
    1. Bozdech Z., Zhu J., Joachimiak M.P., Cohen F.E., Pulliam B., DeRisi J.L., Zhu J., Joachimiak M.P., Cohen F.E., Pulliam B., DeRisi J.L., Joachimiak M.P., Cohen F.E., Pulliam B., DeRisi J.L., Cohen F.E., Pulliam B., DeRisi J.L., Pulliam B., DeRisi J.L., DeRisi J.L. Expression profiling of the schizont and trophozoite stages of Plasmodium falciparum with a long-oligonucleotide microarray. Genome Biol. 2003;4:R9. doi: 10.1186/gb-2003-4-2-r9. - DOI - PMC - PubMed
    1. Byrnes J.K., Morris G.P., Li W.H., Morris G.P., Li W.H., Li W.H. Reorganization of adjacent gene relationships in yeast genomes by whole-genome duplication and gene deletion. Mol. Biol. Evol. 2006;23:1136–1143. - PubMed

Publication types

Associated data