. 2008 Oct;173(4):981-92.
doi: 10.2353/ajpath.2008.070863. Epub 2008 Sep 11.

Heme oxygenase-1 prevents airway mucus hypersecretion induced by cigarette smoke in rodents and humans

Affiliations

Heme oxygenase-1 prevents airway mucus hypersecretion induced by cigarette smoke in rodents and humans

Abdelhamid Almolki et al. Am J Pathol. 2008 Oct.

Erratum in

  • Am J Pathol. 2008 Dec;173(6):1929. Leynaert, A Benedicte [corrected to Leynaert, Benedicte]

Abstract

We investigated the role of heme oxygenase-1 (HO-1), a powerful anti-inflammatory and anti-oxidant enzyme, in modulating cigarette smoke (CS)-induced mucus secretion. In both rats and mice, 5-day CS exposure increased HO-1 expression and activity, mucus secretion, MUCIN 5AC (MUC5AC) gene and protein expression, and local inflammation, along with up-regulation of dual oxidase 1 gene expression and both the activity and phosphorylation of the epidermal growth factor receptor, which is involved in MUC5AC induction. Pharmacological induction of HO-1 prevented these actions and inhibition of HO-1 expression by a specific siRNA potentiated them. In French participants to the European Community Respiratory Health Survey II (n = 210, 30 to 53 years of age, 50% males) exposed to CS, a significant increase in the percentage of participants with chronic sputum was observed in those harboring at least one allele with a long (GT)(n) in the HO-1 promoter gene (>33 repeats), which is associated with a low level of HO-1 protein expression, compared with those with a short number of (GT)n repeats (21.7% versus 8.6%, P = 0.047). No such results were observed in those who had never smoked (n = 297). We conclude that HO-1 has a significant protective effect against airway mucus hypersecretion in animals and humans exposed to CS.


Figures
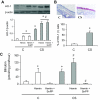
Figure 1
Figure 1
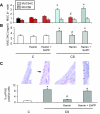
HO-1 expression and HO activity in rats exposed or not to CS. A: Typical Western blot showing detection of HO-1 protein expression. The bottom part shows densitometric analysis of HO-1 expression expressed as a ratio of β-actin expression. C, Exposure to room air; CS, exposure to cigarette smoke; H, hemin; SnPP-IX, tin protoporphyrin IX. Values are mean ± SEM, n = 8 to 10 in each group. *P < 0.05 versus vehicle-treated C; #P < 0.05 versus vehicle-treated CS. B: Immunohistochemical analysis of HO-1 expression in the trachea of one rat exposed to room air (C) and in another exposed to cigarette smoke (CS). Staining was observed in the tracheal epithelium of the CS rat. No staining was observed with the isotype antibody (data not shown). The bottom part shows the percentage of HO-1 (+) cells over the whole number of epithelial cells. Values are mean ± SEM, n = 8 to 10 in each group. *P < 0.05 versus C. C: HO activity. C, Exposure to room air; CS, exposure to cigarette smoke; H, hemin; SnPP-IX, tin protoporphyrin IX. Abbreviations are the same as those in A. Values are mean ± SEM, n = 8 to 10 in each group. *P < 0.05 versus vehicle-treated C; #P < 0.05 versus vehicle-treated CS. Original magnifications, ×40.
Figure 2
Figure 2
Mucin expression and mucus production in rats exposed or not to cigarette smoke. A: Real-time RT-PCR analysis of MUC5AC and MUC5B mRNA expression expressed as a ratio of β-actin mRNA level. Abbreviations are the same as those in Figure 1. Values are mean ± SEM, n = 12 to 15 in each group. *P < 0.05 versus vehicle-treated C; #P < 0.05 versus vehicle-treated CS. B: MUC5AC protein levels in BAL fluid. Abbreviations are the same as those in Figure 1. Values are mean ± SEM, n = 12 to 15 in each group. *P < 0.05 versus vehicle-treated C; #P < 0.05 versus vehicle-treated CS. C: PAS staining in trachea. PAS(+) cells are stained in red. The arrow shows a PAS(+) cell. The bottom part shows the percentage of PAS(+) cells over the whole number of epithelial cells. Abbreviations are the same as those in Figure 1. Values are mean ± SEM, n = 12 to 15 in each group. *P < 0.05 versus vehicle-treated C; #P < 0.05 versus vehicle-treated CS. Original magnifications, ×40.
Figure 3
Figure 3
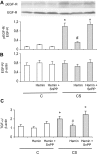
EGF pathway in rat epithelium. A: Typical Western blot showing detection of phosphorylated (pEGF-R, Tyr845) and nonphosphorylated EGF-R expression. The bottom part shows densitometric analysis of pEGF-R expression as a ratio of EGF-R expression. Abbreviations are the same as those in Figure 1. Values are mean ± SEM, n = 10 to 12 in each group. *P < 0.05 versus vehicle-treated C; #P < 0.05 versus vehicle-treated CS. B: Real-time RT-PCR analysis of EGF-R mRNA expression as a ratio of β-actin mRNA level. Abbreviations are the same as those in Figure 1. Values are mean ± SEM, n = 12 to 15 in each group. C: Real-time RT-PCR analysis of TGF-α mRNA expression as a ratio of β-actin mRNA level. Abbreviations are the same as those in Figure 1. Values are mean ± SEM, n = 12 to 15 in each group. *P < 0.05 versus vehicle-treated C; #P < 0.05 versus vehicle-treated CS.
Figure 4
Figure 4
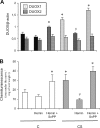
DUOX1 pathway in rats exposed or not to cigarette smoke. A: Real-time RT-PCR analysis of DUOX1 and DUOX2 mRNA expression expressed as a ratio of β-actin mRNA level. Abbreviations are the same as those in Figure 1. Values are mean ± SEM, n = 12 to 15 in each group. *P < 0.05 versus vehicle-treated C; #P < 0.05 versus vehicle-treated CS. B: Reactive oxygen species production in tracheal rings evaluated by chemiluminescence. Values are expressed as the total chemiluminescence produced (cpm) throughout 60 minutes, normalized to the wet weight of the ring. Abbreviations are the same as those in Figure 1. Values are mean ± SEM, n = 10 to 12 in each group. *P < 0.05 versus vehicle-treated C; #P < 0.05 versus vehicle-treated CS.
Figure 5
Figure 5
Effects of apocynin treatment in rats exposed or not to cigarette smoke. A: Reactive oxygen species production in tracheal rings evaluated by chemiluminescence. Values are expressed as the total chemiluminescence produced (cpm) throughout 60 minutes, normalized to the wet weight of the ring. C, Animals exposed to room air; CS, animals exposed to cigarette smoke; Apo, apocynin. Values are mean ± SEM, n = 10 to 12 in each group. *P < 0.05 versus vehicle-treated C; #P < 0.05 versus vehicle-treated CS. B: Real-time RT-PCR analysis of MUC5AC expression expressed as a ratio of β-actin mRNA level. Abbreviations are the same as those in A. Values are mean ± SEM, n = 10 to 12 in each group. *P < 0.05 versus vehicle-treated C; #P < 0.05 versus vehicle-treated CS. C: PAS staining in trachea. PAS(+) cells are stained in red. The arrow shows a PAS(+) cell. The bottom part shows the percentage of PAS(+) cells over the whole number of epithelial cells. Abbreviations are the same as those in A. Values are mean ± SEM, n = 10 to 12 in each group. *P < 0.05 versus vehicle-treated C; #P < 0.05 versus vehicle-treated CS. D: Typical Western blot showing detection of phosphorylated (pEGF-R, Tyr845) and nonphosphorylated EGF-R expression. The bottom part shows densitometric analysis of pEGF-R expression expressed as a ratio of EGF-R expression. Abbreviations are the same as those in A. Values are mean ± SEM, n = 10 to 12 in each group. *P < 0.05 versus vehicle-treated C; #P < 0.05 versus vehicle-treated CS. Original magnifications, ×40.
Figure 6
Figure 6
Effect of HO-1 siRNA administration in mice. A: Western blot analysis of HO-1 protein expression in trachea. The bottom part shows densitometric analysis of HO-1 expression expressed as a ratio of β-actin levels. C, mice exposed to room air; CS, mice exposed to cigarette smoke; NS, nonspecific siRNA. Values are mean ± SEM, n = 8 in each group. *P < 0.05 versus C mice treated with nonspecific siRNA; #P < 0.05 versus CS mice treated with nonspecific siRNA. B: Real-time RT-PCR analysis of DUOX1 and MUC5AC expression expressed as a ratio of β-actin mRNA levels. Abbreviations are the same as those in A. Values are mean ± SEM, n = 8 in each group. *P < 0.05 versus C mice treated with nonspecific siRNA; #P < 0.05 versus CS mice treated with nonspecific siRNA. C: Reactive oxygen species production in tracheal rings evaluated by chemiluminescence. Values are expressed as the total chemiluminescence produced (cpm) throughout 60 minutes, normalized to the wet weight of the ring. Values are mean ± SEM, n = 6 to 8 in each group. *P < 0.05 versus C mice treated with nonspecific siRNA; #P < 0.05 versus CS mice treated with nonspecific siRNA. D: Typical Western blot showing detection of phosphorylated (pEGF-R, Tyr845) and nonphosphorylated EGF-R expression. The bottom part shows densitometric analysis of pEGF-R expression expressed as a ratio of EGF-R expression. Values are mean ± SEM, n = 6 to 8 in each group. *P < 0.05 versus C mice treated with nonspecific siRNA; #P < 0.05 versus CS mice treated with nonspecific siRNA. E: Real-time RT-PCR analysis of TGF-α expression expressed as a ratio of β-actin mRNA levels. Abbreviations are the same as those in A. Values are mean ± SEM, n = 8 in each group. *P < 0.05 versus C mice treated with nonspecific siRNA; #P < 0.05 versus CS mice treated with nonspecific siRNA. F: PAS staining in trachea. PAS(+) cells are stained in red (black arrows). Magnification is ×40. Abbreviations are the same as those in A. The bottom part shows the percentage of PAS(+) cells over the whole number of submucosal glands epithelial cells. Values are mean ± SEM, n = 6 to 8 in each group. *P < 0.05 versus C mice treated with nonspecific siRNA; #P < 0.05 versus CS mice treated with nonspecific siRNA. Original magnifications, ×40.
Figure 7
Figure 7
Consequences of HO-1 gene promoter polymorphism. A: Prevalence of chronic sputum by HO-1 genotype [group L+ (one or two L alleles) versus group L (no L allele)] in 210 smokers and 297 never-smokers examined in 2000 in the European Community Respiratory Health Survey. B: HO-1 protein levels in plasma in a subset of L+ and L patients (32 smokers and 40 never-smokers). Values are mean ± SD. *P < 0.05 versus respective L+ patients.

Similar articles

Cited by

References

    1. Burgel PR, Nadel JA. Roles of epidermal growth factor receptor activation in epithelial cell repair and mucin production in airway epithelium. Thorax. 2004;59:992–996. - PMC - PubMed
    1. Barnes PJ, Shapiro SD, Pauwels RA. Chronic obstructive pulmonary disease: molecular and cellular mechanisms. Eur Respir J. 2003;22:672–688. - PubMed
    1. American Thoracic Society Standards for the diagnosis and care of patients with chronic obstructive pulmonary disease (COPD) and asthma. Am Rev Respir Dis. 1987:225–244. - PubMed
    1. Vestbo J, Prescott E, Lange P. Association of chronic mucus hypersecretion with FEV1 decline and chronic obstructive pulmonary disease morbidity. Copenhagen City Heart Study Group. Am J Respir Crit Care Med. 1996;153:1530–1535. - PubMed
    1. Vestbo J. Chronic mucus hypersecretion, exacerbations and natural history of COPD. Exp Lung Res. 2005;31(Suppl 1):63–65. - PubMed

Publication types

MeSH terms