

Nuclear factor-kappaB is a critical mediator of Ste20-like proline-/alanine-rich kinase regulation in intestinal inflammation
- PMID: 18787102
- PMCID: PMC2543070
- DOI: 10.2353/ajpath.2008.080339
Nuclear factor-kappaB is a critical mediator of Ste20-like proline-/alanine-rich kinase regulation in intestinal inflammation
Abstract
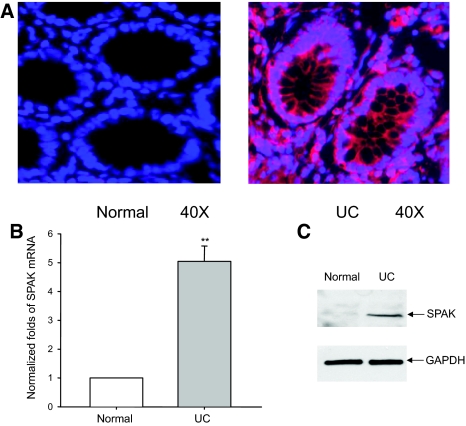
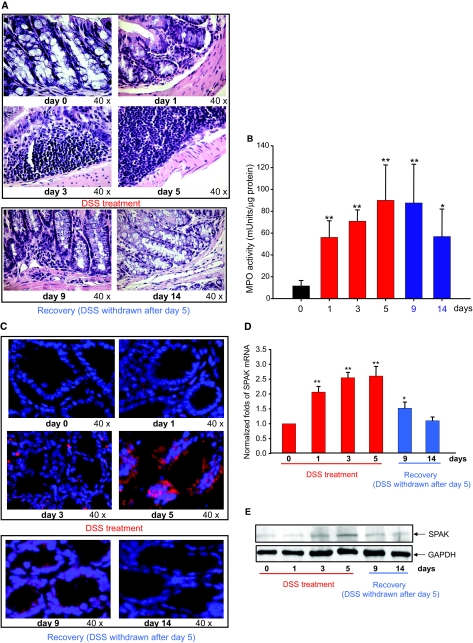
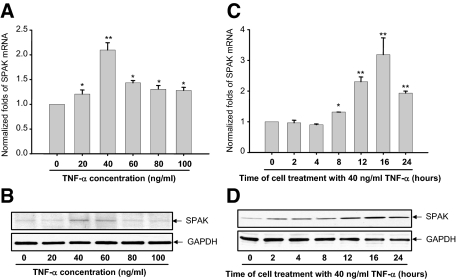
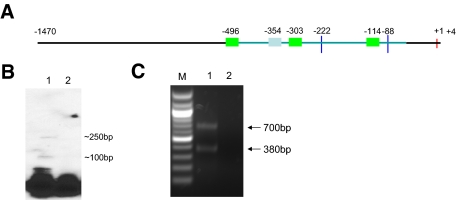
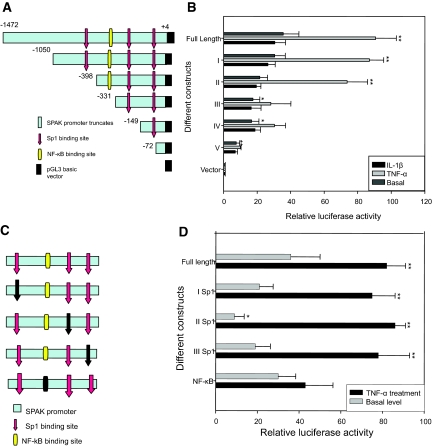
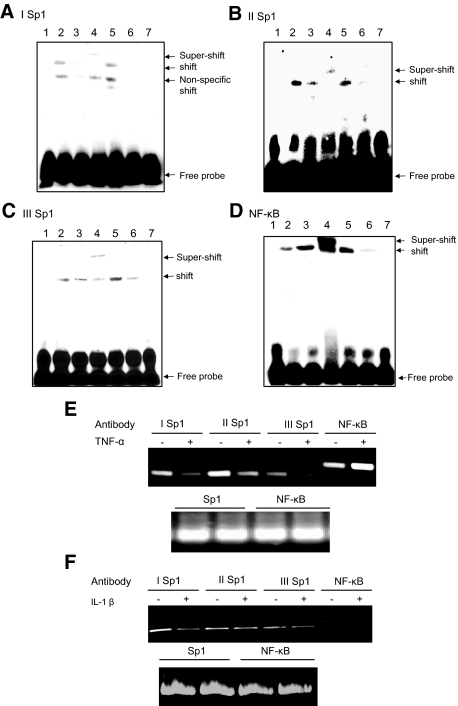
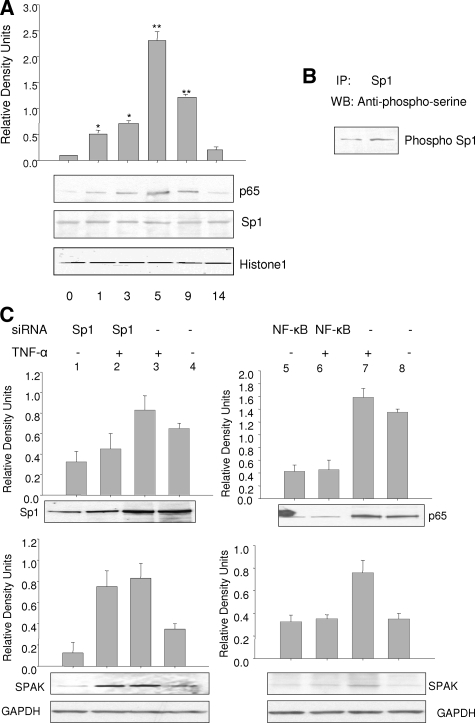
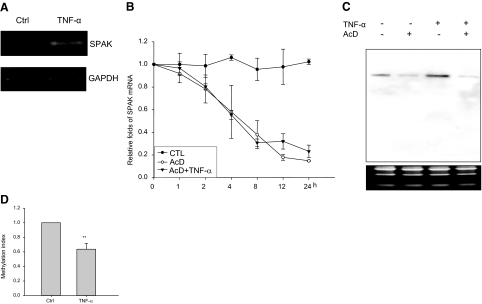
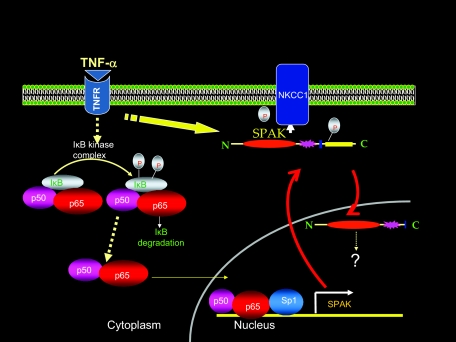
Inflammatory bowel disease (IBD) is thought to result from commensal flora, aberrant cellular stress, and genetic factors. Here we show that the expression of colonic Ste20-like proline-/alanine-rich kinase (SPAK) that lacks a PAPA box and an F-alpha helix loop is increased in patients with IBD. The same effects were observed in a mouse model of dextran sodium sulfate-induced colitis and in Caco2-BBE cells treated with the pro-inflammatory cytokine tumor necrosis factor (TNF)-alpha. The 5'-flanking region of the SPAK gene contains two transcriptional start sites, three transcription factor Sp1-binding sites, and one transcription factor nuclear factor (NF)-kappaB-binding site, but no TATA elements. The NF-kappaB-binding site was essential for stimulated SPAK promoter activity by TNF-alpha, whereas the Sp1-binding sites were important for basal promoter activity. siRNA-induced knockdown of NF-kappaB, but not of Sp1, reduced TNF-alpha-induced SPAK expression. Nuclear run-on and mRNA decay assays demonstrated that TNF-alpha directly increased SPAK mRNA transcription without affecting SPAK mRNA stability. Furthermore, up-regulation of NF-kappaB expression and demethylation of the CpG islands induced by TNF-alpha also played roles in the up-regulation of SPAK expression. In conclusion, our data indicate that during inflammatory conditions, TNF-alpha is a key regulator of SPAK expression. The development of compounds that can either modulate or disrupt the activity of SPAK-mediated pathways is therefore important for the control and attenuation of downstream pathological responses, particularly in IBD.
Figures
Similar articles
-
Ste20-related proline/alanine-rich kinase (SPAK) regulated transcriptionally by hyperosmolarity is involved in intestinal barrier function.PLoS One. 2009;4(4):e5049. doi: 10.1371/journal.pone.0005049. Epub 2009 Apr 3. PLoS One. 2009. PMID: 19343169 Free PMC article.
-
Characterization of the human intestinal CD98 promoter and its regulation by interferon-gamma.Am J Physiol Gastrointest Liver Physiol. 2007 Feb;292(2):G535-45. doi: 10.1152/ajpgi.00385.2006. Epub 2006 Oct 5. Am J Physiol Gastrointest Liver Physiol. 2007. PMID: 17023546
-
Cloning and characterization of a new intestinal inflammation-associated colonic epithelial Ste20-related protein kinase isoform.Biochim Biophys Acta. 2007 Feb;1769(2):106-16. doi: 10.1016/j.bbaexp.2007.01.003. Epub 2007 Jan 23. Biochim Biophys Acta. 2007. PMID: 17321610 Free PMC article.
-
NF-κB, Sp1 and NF-Y as transcriptional regulators of human SND1 gene.Biochimie. 2013 Apr;95(4):735-42. doi: 10.1016/j.biochi.2012.10.029. Epub 2012 Nov 15. Biochimie. 2013. PMID: 23160072
-
A human-specific TNF-responsive promoter for Goodpasture antigen-binding protein.FEBS J. 2005 Oct;272(20):5291-305. doi: 10.1111/j.1742-4658.2005.04925.x. FEBS J. 2005. PMID: 16218959
Cited by
-
Tumor necrosis factor alpha modulates the dynamics of the plasminogen-mediated early interaction between Bifidobacterium animalis subsp. lactis and human enterocytes.Appl Environ Microbiol. 2012 Apr;78(7):2465-9. doi: 10.1128/AEM.07883-11. Epub 2012 Jan 27. Appl Environ Microbiol. 2012. PMID: 22287006 Free PMC article.
-
NF-κB Signaling-Mediated Activation of WNK-SPAK-NKCC1 Cascade in Worsened Stroke Outcomes of Ang II-Hypertensive Mice.Stroke. 2022 May;53(5):1720-1734. doi: 10.1161/STROKEAHA.121.038351. Epub 2022 Mar 11. Stroke. 2022. PMID: 35272484 Free PMC article.
-
Molecular physiology of SPAK and OSR1: two Ste20-related protein kinases regulating ion transport.Physiol Rev. 2012 Oct;92(4):1577-617. doi: 10.1152/physrev.00009.2012. Physiol Rev. 2012. PMID: 23073627 Free PMC article. Review.
-
The choroid plexus links innate immunity to CSF dysregulation in hydrocephalus.Cell. 2023 Feb 16;186(4):764-785.e21. doi: 10.1016/j.cell.2023.01.017. Cell. 2023. PMID: 36803604 Free PMC article.
-
Ste20-related proline/alanine-rich kinase (SPAK) regulated transcriptionally by hyperosmolarity is involved in intestinal barrier function.PLoS One. 2009;4(4):e5049. doi: 10.1371/journal.pone.0005049. Epub 2009 Apr 3. PLoS One. 2009. PMID: 19343169 Free PMC article.
References
-
- Goyette P, Labbé C, Trinh TT, Xavier RJ, Rioux JD. Molecular pathogenesis of inflammatory bowel disease: genotypes, phenotypes and personalized medicine. Ann Med. 2007;39:177–199. - PubMed
-
- Peltekova VD, Wintle RF, Rubin LA, Amos CI, Huang Q, Gu X, Newman B, Van Oene M, Cescon D, Greenberg G, Griffiths AM, St George-Hyslop PH, Siminovitch KA. Functional variants of OCTN cation transporter genes are associated with Crohn disease. Nat Genet. 2004;36:471–475. - PubMed
-
- Stoll M, Corneliussen B, Costello CM, Waetzig GH, Mellgard B, Koch WA, Rosenstiel P, Albrecht M, Croucher PJ, Seegert D, Nikolaus S, Hampe J, Lengauer T, Pierrou S, Foelsch UR, Mathew CG, Lagerstrom-Fermer M, Schreiber S. Genetic variation in DLG5 is associated with inflammatory bowel disease. Nat Genet. 2004;36:476–480. - PubMed
-
- Kyriakis JM. Signaling by the germinal center kinase family of protein kinases. J Biol Chem. 1999;274:5259–5262. - PubMed
-
- Widmann C, Gibson S, Jarpe MB, Johnson GL. Mitogen-activated protein kinase: conservation of a three-kinase module from yeast to human. Physiol Rev. 1999;79:143–180. - PubMed
Publication types
MeSH terms
Substances
Grants and funding
LinkOut - more resources
Full Text Sources
