

Tumor recovery by angiogenic switch from sprouting to intussusceptive angiogenesis after treatment with PTK787/ZK222584 or ionizing radiation
- PMID: 18787105
- PMCID: PMC2543084
- DOI: 10.2353/ajpath.2008.071131
Tumor recovery by angiogenic switch from sprouting to intussusceptive angiogenesis after treatment with PTK787/ZK222584 or ionizing radiation
Abstract
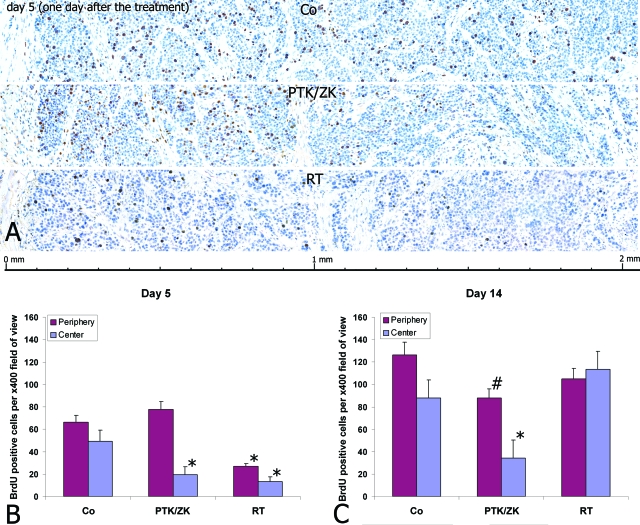
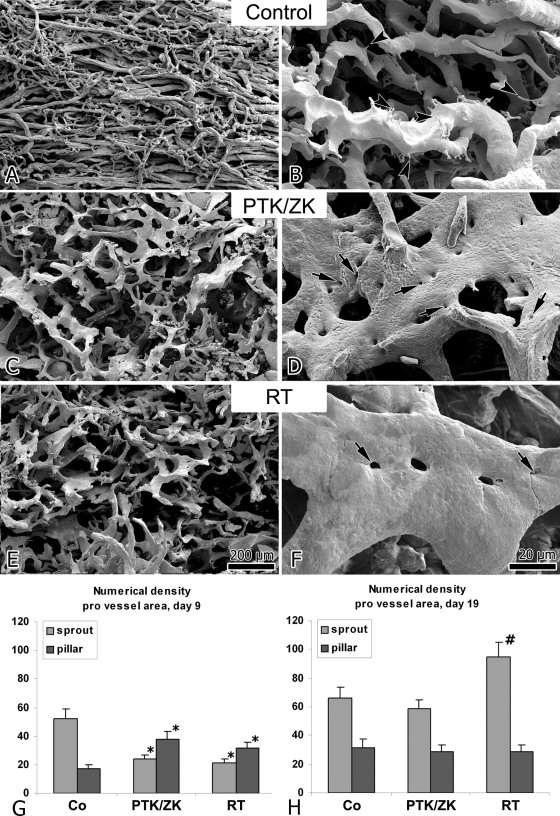
Inhibitors of angiogenesis and radiation induce compensatory changes in the tumor vasculature both during and after treatment cessation. To assess the responses to irradiation and vascular endothelial growth factor-receptor tyrosine kinase inhibition (by the vascular endothelial growth factor tyrosine kinase inhibitor PTK787/ZK222854), mammary carcinoma allografts were investigated by vascular casting; electron, light, and confocal microscopy; and immunoblotting. Irradiation and anti-angiogenic therapy had similar effects on the tumor vasculature. Both treatments reduced tumor vascularization, particularly in the tumor medulla. After cessation of therapy, the tumor vasculature expanded predominantly by intussusception with a plexus composed of enlarged sinusoidal-like vessels containing multiple transluminal tissue pillars. Tumor revascularization originated from preserved alpha-smooth muscle actin-positive vessels in the tumor cortex. Quantification revealed that recovery was characterized by an angiogenic switch from sprouting to intussusception. Up-regulated alpha-smooth muscle actin-expression during recovery reflected the recruitment of alpha-smooth muscle actin-positive cells for intussusception as part of the angio-adaptive mechanism. Tumor recovery was associated with a dramatic decrease (by 30% to 40%) in the intratumoral microvascular density, probably as a result of intussusceptive pruning and, surprisingly, with only a minimal reduction of the total microvascular (exchange) area. Therefore, the vascular supply to the tumor was not severely compromised, as demonstrated by hypoxia-inducible factor-1alpha expression. Both irradiation and anti-angiogenic therapy cause a switch from sprouting to intussusceptive angiogenesis, representing an escape mechanism and accounting for the development of resistance, as well as rapid recovery, after cessation of therapy.
Figures


Similar articles
-
Effect of VEGF receptor inhibitor PTK787/ZK222584 [correction of ZK222548] combined with ionizing radiation on endothelial cells and tumour growth.Br J Cancer. 2001 Dec 14;85(12):2010-6. doi: 10.1054/bjoc.2001.2166. Br J Cancer. 2001. PMID: 11747347 Free PMC article.
-
Ionizing radiation antagonizes tumor hypoxia induced by antiangiogenic treatment.Clin Cancer Res. 2006 Jun 1;12(11 Pt 1):3518-24. doi: 10.1158/1078-0432.CCR-05-2816. Clin Cancer Res. 2006. PMID: 16740778
-
The effects of PTK787/ZK222584, an inhibitor of VEGFR and PDGFRβ pathways, on intussusceptive angiogenesis and glomerular recovery from Thy1.1 nephritis.Am J Pathol. 2011 Apr;178(4):1899-912. doi: 10.1016/j.ajpath.2010.12.049. Am J Pathol. 2011. PMID: 21435466 Free PMC article.
-
Intussusceptive microvascular growth in tumors.Cancer Lett. 2012 Mar 28;316(2):126-31. doi: 10.1016/j.canlet.2011.10.040. Epub 2011 Nov 4. Cancer Lett. 2012. PMID: 22197620 Review.
-
Targeting tumor micro-environment for design and development of novel anti-angiogenic agents arresting tumor growth.Prog Biophys Mol Biol. 2013 Nov;113(2):333-54. doi: 10.1016/j.pbiomolbio.2013.10.001. Epub 2013 Oct 15. Prog Biophys Mol Biol. 2013. PMID: 24139944 Review.
Cited by
-
Nitric oxide synthase inhibition enhances the antitumor effect of radiation in the treatment of squamous carcinoma xenografts.PLoS One. 2011;6(5):e20147. doi: 10.1371/journal.pone.0020147. Epub 2011 May 25. PLoS One. 2011. PMID: 21647438 Free PMC article.
-
From sprouting angiogenesis to erythrocytes generation by cancer stem cells: evolving concepts in tumor microcirculation.Biomed Res Int. 2014;2014:986768. doi: 10.1155/2014/986768. Epub 2014 Aug 4. Biomed Res Int. 2014. PMID: 25162040 Free PMC article. Review.
-
The emerging potential of quantitative MRI biomarkers for the early prediction of brain metastasis response after stereotactic radiosurgery: a scoping review.Quant Imaging Med Surg. 2023 Feb 1;13(2):1174-1189. doi: 10.21037/qims-22-412. Epub 2023 Jan 2. Quant Imaging Med Surg. 2023. PMID: 36819250 Free PMC article.
-
Dynamic MR imaging for functional vascularization depends on tissue factor signaling in glioblastoma.Cancer Biol Ther. 2018 May 4;19(5):416-426. doi: 10.1080/15384047.2018.1423924. Epub 2018 Feb 6. Cancer Biol Ther. 2018. PMID: 29333924 Free PMC article.
-
A new mechanism for pillar formation during tumor-induced intussusceptive angiogenesis: inverse sprouting.Am J Pathol. 2011 Sep;179(3):1573-85. doi: 10.1016/j.ajpath.2011.05.033. Epub 2011 Aug 9. Am J Pathol. 2011. PMID: 21827961 Free PMC article.
References
-
- Winkler F, Kozin SV, Tong RT, Chae SS, Booth MF, Garkavtsev I, Xu L, Hicklin DJ, Fukumura D, di Tomaso E, Munn LL, Jain RK. Kinetics of vascular normalization by VEGFR2 blockade governs brain tumor response to radiation: role of oxygenation, angiopoietin-1, and matrix metalloproteinases. Cancer Cell. 2004;6:553–563. - PubMed
-
- Ferrara N, Kerbel RS. Angiogenesis as a therapeutic target. Nature. 2005;438:967–974. - PubMed
-
- Jain RK. Normalization of tumor vasculature: an emerging concept in antiangiogenic therapy. Science. 2005;307:58–62. - PubMed
-
- Kerbel RS. Antiangiogenic therapy: a universal chemosensitization strategy for cancer? Science. 2006;312:1171–1175. - PubMed
-
- Marx J. Angiogenesis. A boost for tumor starvation. Science. 2003;301:452–454. - PubMed
Publication types
MeSH terms
Substances
LinkOut - more resources
Full Text Sources
