Slowing down as an early warning signal for abrupt climate change
- PMID: 18787119
- PMCID: PMC2567225
- DOI: 10.1073/pnas.0802430105
Slowing down as an early warning signal for abrupt climate change
Abstract
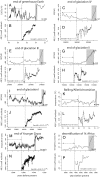
In the Earth's history, periods of relatively stable climate have often been interrupted by sharp transitions to a contrasting state. One explanation for such events of abrupt change is that they happened when the earth system reached a critical tipping point. However, this remains hard to prove for events in the remote past, and it is even more difficult to predict if and when we might reach a tipping point for abrupt climate change in the future. Here, we analyze eight ancient abrupt climate shifts and show that they were all preceded by a characteristic slowing down of the fluctuations starting well before the actual shift. Such slowing down, measured as increased autocorrelation, can be mathematically shown to be a hallmark of tipping points. Therefore, our results imply independent empirical evidence for the idea that past abrupt shifts were associated with the passing of critical thresholds. Because the mechanism causing slowing down is fundamentally inherent to tipping points, it follows that our way to detect slowing down might be used as a universal early warning signal for upcoming catastrophic change. Because tipping points in ecosystems and other complex systems are notoriously hard to predict in other ways, this is a promising perspective.
Conflict of interest statement
The authors declare no conflict of interest.
Figures


Similar articles
-
Abrupt changes in Great Britain vegetation carbon projected under climate change.Glob Chang Biol. 2020 Aug;26(8):4436-4448. doi: 10.1111/gcb.15144. Epub 2020 May 28. Glob Chang Biol. 2020. PMID: 32464708
-
Lack of Critical Slowing Down Suggests that Financial Meltdowns Are Not Critical Transitions, yet Rising Variability Could Signal Systemic Risk.PLoS One. 2016 Jan 13;11(1):e0144198. doi: 10.1371/journal.pone.0144198. eCollection 2016. PLoS One. 2016. PMID: 26761792 Free PMC article.
-
No warning for slow transitions.J R Soc Interface. 2021 Mar;18(176):20200935. doi: 10.1098/rsif.2020.0935. Epub 2021 Mar 31. J R Soc Interface. 2021. PMID: 33784883 Free PMC article.
-
Approaching a state shift in Earth's biosphere.Nature. 2012 Jun 6;486(7401):52-8. doi: 10.1038/nature11018. Nature. 2012. PMID: 22678279 Review.
-
Overshooting tipping point thresholds in a changing climate.Nature. 2021 Apr;592(7855):517-523. doi: 10.1038/s41586-021-03263-2. Epub 2021 Apr 21. Nature. 2021. PMID: 33883733 Review.
Cited by
-
Body size distributions signal a regime shift in a lake ecosystem.Proc Biol Sci. 2016 Jun 29;283(1833):20160249. doi: 10.1098/rspb.2016.0249. Proc Biol Sci. 2016. PMID: 27335415 Free PMC article.
-
Early warning signals of stochastic switching.Proc Biol Sci. 2013 Sep 7;280(1766):20130686. doi: 10.1098/rspb.2013.0686. Print 2013 Sep 7. Proc Biol Sci. 2013. PMID: 23843385 Free PMC article. No abstract available.
-
Early warning signals for critical transitions in a thermoacoustic system.Sci Rep. 2016 Oct 21;6:35310. doi: 10.1038/srep35310. Sci Rep. 2016. PMID: 27767065 Free PMC article.
-
Establishing Monoclonal Gammopathy of Undetermined Significance as an Independent Pre-Disease State of Multiple Myeloma Using Raman Spectroscopy, Dynamical Network Biomarker Theory, and Energy Landscape Analysis.Int J Mol Sci. 2024 Jan 26;25(3):1570. doi: 10.3390/ijms25031570. Int J Mol Sci. 2024. PMID: 38338848 Free PMC article.
-
Critical slowing down suggests that the western Greenland Ice Sheet is close to a tipping point.Proc Natl Acad Sci U S A. 2021 May 25;118(21):e2024192118. doi: 10.1073/pnas.2024192118. Proc Natl Acad Sci U S A. 2021. PMID: 34001613 Free PMC article.
References
-
- Alley RB, et al. Abrupt climate change. Science. 2003;299:2005–2010. - PubMed
-
- Tripati A, Backman J, Elderfield H, Ferretti P. Eocene bipolar glaciation associated with global carbon cycle changes. Nature. 2005;436:341–346. - PubMed
-
- Kump LR. Palaeoclimate—Foreshadowing the glacial era. Nature. 2005;436:333–334. - PubMed
-
- Petit JR, et al. Climate and atmospheric history of the past 420,000 years from the Vostok ice core, Antarctica. Nature. 1999;399:429–436.
-
- Clark PU, Pisias NG, Stocker TF, Weaver AJ. The role of the thermohaline circulation in abrupt climate change. Nature. 2002;415:863–869. - PubMed
Publication types
MeSH terms
LinkOut - more resources
Full Text Sources
Other Literature Sources
Miscellaneous

