. 2008 Sep 23;105(38):14515-20.
doi: 10.1073/pnas.0804571105. Epub 2008 Sep 11.

Regulation of cytotoxic T lymphocyte triggering by PIR-B on dendritic cells

Affiliations

Regulation of cytotoxic T lymphocyte triggering by PIR-B on dendritic cells

Shota Endo et al. Proc Natl Acad Sci U S A. .

Abstract

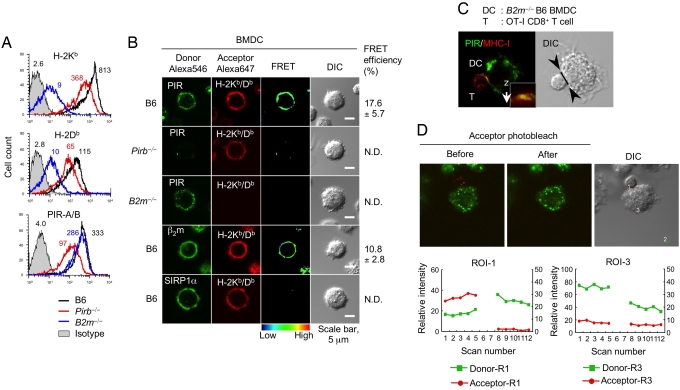
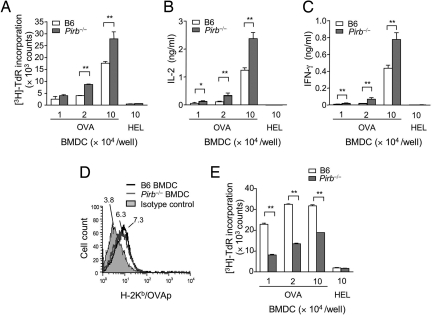
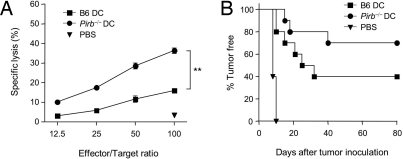
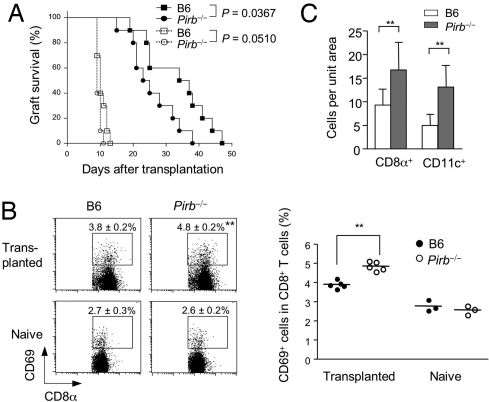
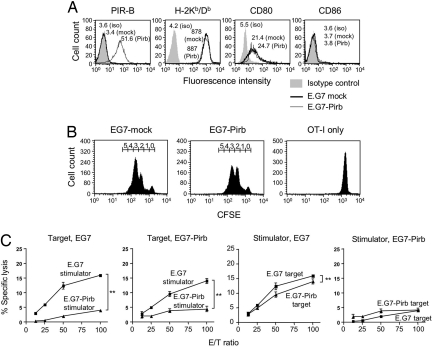
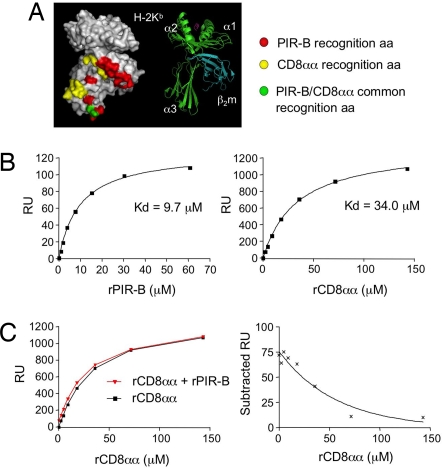
Priming of cytotoxic T lymphocytes (CTLs) by dendritic cells (DCs) is crucial for elimination of pathogens and malignant cells. To activate CTLs, DCs present antigenic peptide-complexed MHC class I molecules (MHC-I) that will be recognized by the CTLs with T cell receptors and CD8 molecules. Here we show that paired Ig-like receptor (PIR)-B, an MHC-I receptor expressed on antigen-presenting cells, can regulate CTL triggering by blocking the access of CD8 molecules to MHC-I. PIR-B-deficient DCs evoked CTLs more efficiently, leading to accelerated graft and tumor rejection. PIR-B(+) non-DC transfectant cells served as less efficient stimulators and targets for CTLs than PIR-B(-) cells at the effector phase in vitro. On surface plasmon resonance analysis, PIR-B and CD8alpha alpha were revealed to compete in binding to MHC-I. Our results may provide a novel strategy for regulating CTL-mediated immunity and diseases in a sterical manner.


Conflict of interest statement

The authors declare no conflict of interest.

Figures

Fig. 1.
Fig. 1.
Cis association between PIR-B and MHC class I on BMDCs and trans binding of PIR-B–MHC class I at immunological synapse. (A) Flow cytometric analysis of BMDCs on expression of H-2 and PIR. Mature B6, Pirb−/−, and B2m−/− BMDCs were stained with anti-H-2Kb, anti-H-2Db, or anti-PIR-A/B, and then analyzed for surface expression. The mean fluorescence intensity (MFI) of each histogram is indicated in the panels. (B) FRET analysis of PIR-B and H-2 on BMDCs. In the left to right panels, excited donor (Alexa546-conjugated anti-PIR-A/B, anti-β2m, and anti-SIRP1α) images (green), excited acceptor (Alexa647-conjugated anti-H-2Kb/Db) images (red), FRET signals (pseudocolor), differential interference contrast (DIC) images, and FRET efficiency (%, means ± SD, n ≥ 5) are shown. (Scale bar: 5 μm.) N.D., not detected (FRET efficiency <0%). (C) Confocal laser scanning microscopic analysis of the interface between BMDCs and CD8+ T cells. OVA peptide-pulsed H-2-less B2m−/− BMDCs and OT-I CD8+ T cells were coincubated, fixed, and then stained with Alexa488-conjugated anti-PIR-A/B and Alexa647-conjugated anti-H-2Kb/Db. Cells were analyzed for the localization of PIR-B and H-2. A z-axis image of the interface (indicated by the line between the arrow-heads in the DIC image) is shown in the inset. (D) FRET analysis of the interface between BMDCs and CD8+ T cells. Cells were stained separately with Alexa546-conjugated anti-PIR-A/B and Alexa647-conjugated anti-H-2Kb/Db, respectively, and coincubated, and FRET was assessed by measuring the donor fluorescence intensity before and after acceptor photobleaching. The relative fluorescence intensity of the DC–T interface [region of interest (ROI)-1] and DC surface (ROI-3) was plotted (Lower). The fluorescence intensity of the background (ROI-2) was measured to calculate the relative intensity. Photobleaching was performed between scans 5 and 8. Significant FRET efficiency was observed at ROI-1 (24.8 ± 17.6%, mean ± SD, n = 6).
Fig. 2.
Fig. 2.
Enhanced MHC class I-restricted antigen presentation by Pirb−/− BMDCs in vitro. (A) OT-I proliferation assay. Irradiated OVA-pulsed BMDCs were cocultured with CD8+ OT-I cells for 24 h. Then [3H]-thymidine was added, and the incorporation of thymidine was measured after 8 h. (B, C) Cytokine production by OT-I cells. The supernatant of a 24-h coculture of OVA-pulsed BMDC and OT-I cells was analyzed for concentrations of IL-2 (B) and IFN-γ (C) by means of a Bio-Plex suspension array system. Data shown are the means for triplicate samples ± SD. (D) Expression level of H-2Kb/OVAp on BMDCs. OVA-pulsed BMDCs were stained with 25-D1.16 antibodies and then analyzed for the expression of H-2Kb/OVAp. The MFI of each histogram is indicated in the panel. (E) OT-II cell proliferation assay. Irradiated OVA-pulsed BMDCs were cocultured with CD4+ OT-II cells for 48 h. Then [3H]-thymidine was added, and the incorporation of thymidine was measured after 8 h. The results are representative of more than three separate experiments. *, P < 0.05; **, P < 0.01.
Fig. 3.
Fig. 3.
Enhanced CTL activation induced by adoptive transfer of Pirb−/− BMDCs. (A) Cytotoxicity assay. Groups of three B6 mice were immunized with OVA-pulsed Pirb−/− BMDCs (circles), B6 BMDCs (squares), or PBS alone (triangle). After 7 days, splenocytes from immunized mice were incubated in vitro for 5 days with irradiated E.G7 cells. After the stimulation, CTL activity was determined by means of a standard 51Cr release assay using E.G7 cells as the target. Data shown are the means for triplicate samples ± SD. The results are representative of more than three separate experiments. (B) Tumor rejection assay. Groups of 10 B6 mice were twice immunized with OVA-pulsed BMDCs into the left footpad. After 7 days, the mice were injected with E.G7 cells s.c. into the left rear leg. Tumor appearance was monitored every 2 days, and a mouse was considered positive when a palpable tumor with a diameter of >5 mm was detected. **, P < 0.01.
Fig. 4.
Fig. 4.
Enhanced rejection of H-Y-incompatible skin grafts in Pirb−/− mice. (A) Skin graft transplantation. Tail skin grafts derived from male B6 mice (solid lines) or female BALB/c×B6 F1 mice (dotted lines) were transplanted onto the lateral thorax of female Pirb−/− mice (circles) and B6 mice (squares). The mice were inspected daily for graft survival. When >80% of the area of a graft had the appearance of scabbing or contraction, it was considered to have been rejected. (B) Flow cytometric analysis of activated CD8+ T cells. Day-14 splenocytes from mice with male B6 skin grafts transplanted (Upper Left) and untransplanted naive mice (Lower Left) were stained with PE-conjugated anti-CD8α and FITC-conjugated anti-CD69, and then analyzed for the activation of CD8+ T cells. The percentages of double-positive cells among total CD8α-positive cells are shown as the means of at least three individual samples ± SD. Data are also expressed as the scattered plots (Right, cumulative data from five transplanted and three naïve mice). (C) Evaluation of infiltrated CD8+ T cells and CD11c+ DCs. Ten units (1 unit; 280 × 375 μm2) of each skin section was examined for the infiltration of CD8+ and CD11c+ cells. Data are shown as the mean cell numbers in 10 units ± SD. *, P < 0.05; **, P < 0.01.
Fig. 5.
Fig. 5.
Inhibition of CTL activities by the Pirb transfectant. (A) Flow cytometric analysis of the PIR-B transfectant. E.G7 cells transfected with Pirb (E.G7-Pirb) and a mock transfectant (E.G7-mock) were analyzed for the expression of PIR-B, H-2, CD80, and CD86. (B) OT-I proliferation induced by the PIR-B transfectant. Mitomycin C-treated E.G7-Pirb or E.G7-mock cells were cocultured with CFSE-labeled OT-I cells for 48 h. Then the cells were analyzed by flow cytometry for CFSE dilution. (C) Effect of PIR-B on the stimulatory and effector phases of CTL activity. B6 mice were immunized with OVA-pulsed B6 BMDCs. After 7 days, splenocytes from immunized mice were incubated in vitro for 5 days with irradiated E.G7 or E.G7-Pirb cells. After the stimulation, CTL activity was determined by means of the standard 4-h 51Cr release assay using E.G7 or E.G7-Pirb cells as the target. The results are representative of more than three separate experiments. **, P < 0.01.
Fig. 6.
Fig. 6.
Competition between PIR-B and CD8 in binding to H-2. (A) H-2Kb recognition sites for PIR-B and CD8αα. Molecular modeling was performed by PDFAMS based on the crystal structure of LILRB1 complexed with HLA-A2 (PDB ID: 1P7Q). (Left) Surface view of H-2Kb. The PIR-B and CD8αα binding sites are colored as indicated. (Right) Three-dimensional conformation of H-2Kb. (B) SPR analysis of PIR-B and CD8αα binding to H-2Kb. Graded concentrations of rPIR-B or rCD8αα were injected onto the sensor chip with 2,400 response units (RU) of H-2Kb immobilized on it, followed by analysis of the binding responses. Lower RU of rPIR-B compared to rCD8aa was attributable to the unstable nature of rPIR-B in solution due to an unknown reason, which has been our consistent observation during generation and purification of the protein. (C) Competitive binding assay. Graded concentration of rCD8αα was injected onto the same sensor chip as that used in the experiment shown in B, with or without a fixed concentration (30.4 μM) of rPIR-B, followed by analysis of the binding responses (Left). The difference in RUs in the presence and absence of rPIR-B was plotted (Right). The results are representative of more than three separate experiments. **, P < 0.01.

Similar articles

Cited by

References

    1. Banchereau J, Steinman RM. Dendritic cells and the control of immunity. Nature. 1998;392:245–252. - PubMed
    1. Heath WR, Carbone FR. Cross-presentation, dendritic cells, tolerance and immunity. Annu Rev Immunol. 2001;19:47–64. - PubMed
    1. Guermonprez P, et al. Antigen presentation and T cell stimulation by dendritic cells. Annu Rev Immunol. 2002;20:621–667. - PubMed
    1. Cresswell P, et al. Mechanisms of MHC class I-restricted antigen processing and cross-presentation. Immunol Rev. 2005;207:145–157. - PubMed
    1. Gao GF, et al. Crystal structure of the complex between human CD8αα and HLA-A2. Nature. 1997;387:630–634. - PubMed

Publication types

MeSH terms