. 2008 Nov;36(11):1793-804.
doi: 10.1007/s10439-008-9561-5. Epub 2008 Sep 12.

Numerical modeling of the flow in intracranial aneurysms: prediction of regions prone to thrombus formation

Affiliations

Numerical modeling of the flow in intracranial aneurysms: prediction of regions prone to thrombus formation

V L Rayz et al. Ann Biomed Eng. 2008 Nov.

Abstract

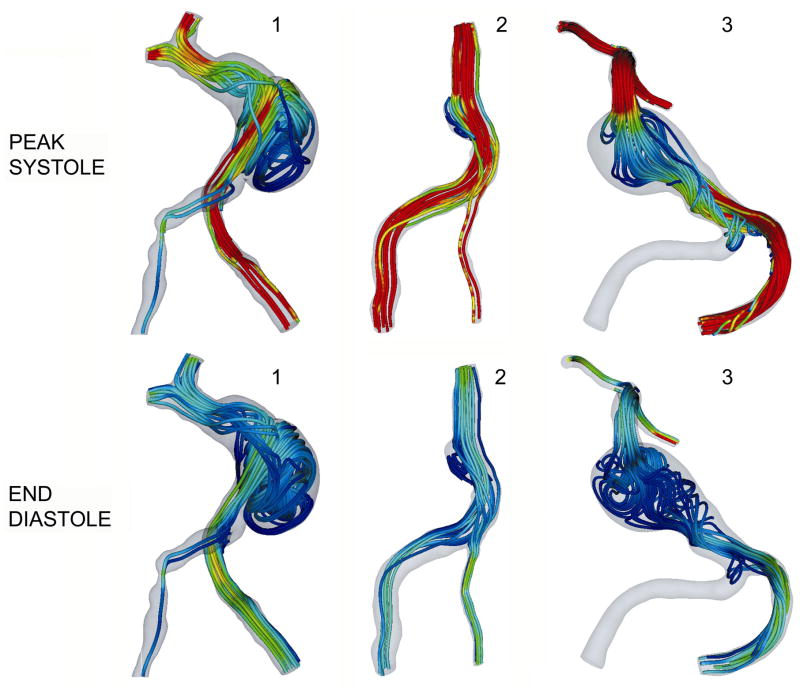
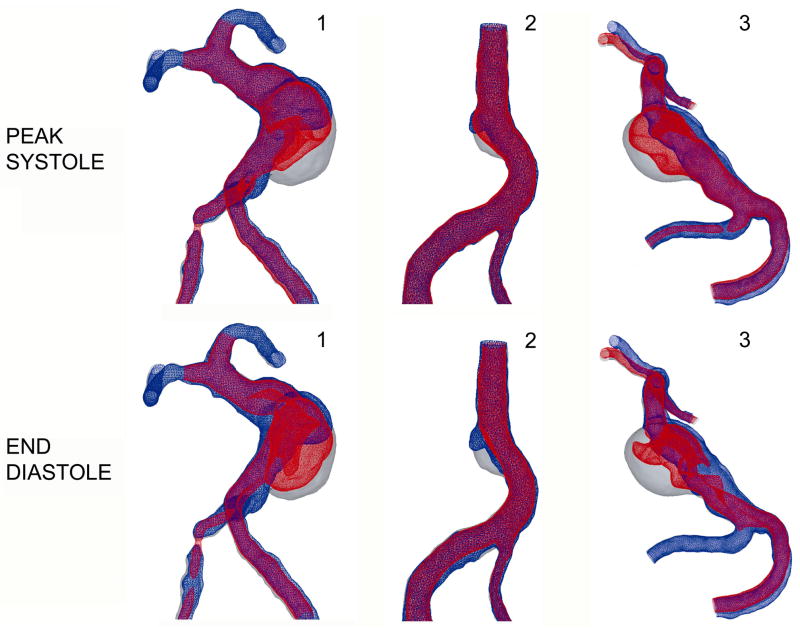
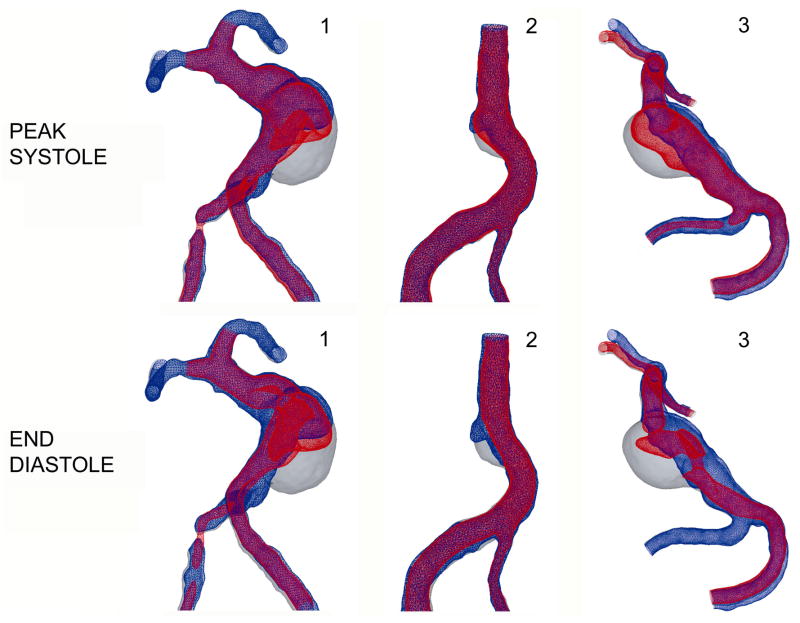
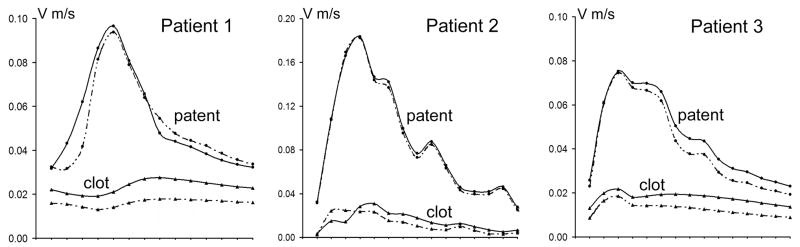
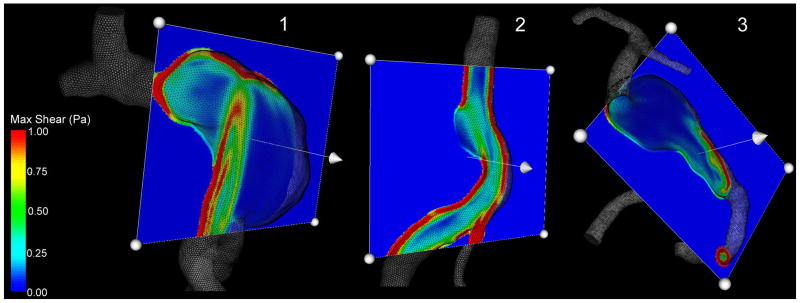
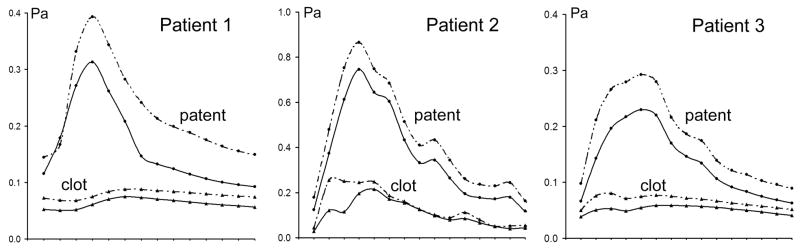
The deposition of intralumenal thrombus in intracranial aneurysms adds a risk of thrombo-embolism over and above that posed by mass effect and rupture. In addition to biochemical factors, hemodynamic factors that are governed by lumenal geometry and blood flow rates likely play an important role in the thrombus formation and deposition process. In this study, patient-specific computational fluid dynamics (CFD) models of blood flow were constructed from MRA data for three patients who had fusiform basilar aneurysms that were thrombus free and then proceeded to develop intralumenal thrombus. In order to determine whether features of the flow fields could suggest which regions had an elevated potential for thrombus deposition, the flow was modeled in the baseline, thrombus-free geometries. Pulsatile flow simulations were carried out using patient-specific inlet flow conditions measured with MR velocimetry. Newtonian and non-Newtonian blood behavior was considered. A strong similarity was found between the intra-aneurysmal regions with CFD-predicted slow, recirculating flows and the regions of thrombus deposition observed in vivo in the follow-up MR studies. In two cases with larger aneurysms, the agreement between the low velocity zones and clotted-off regions improved when non-Newtonian blood behavior was taken into account. A similarity was also found between the calculated low shear stress regions and the regions that were later observed to clot.


Figures

Figure 1
Figure 1
Maximum Intensity Projection (MIP) images from MRA studies of a patient with a giant basilar aneurysm: (A) Image of aneurysm at maximum size; (B) Image acquired nine months after A.
Figure 2
Figure 2
MIP images from an MRA study on a patient with a basilar aneurysm: (A) Image of aneurysm at maximum size; (B) Image acquired seven months after A.
Figure 3
Figure 3
MIP of CE-MRA studies: a) giant basilar aneurysm presenting with rapid growth before surgery; b) after clipping of the right vertebral artery. Arrow 1 shows the clip location on the right vertebral artery; arrow 2 points at the bypass connecting the clipped vertebral to the superior cerebellar artery (Note that the remainder of the bypass lies outside the imaging volume and is not visualized).
Figure 4
Figure 4
Co-registration of the base-line (gray) and follow-up (black) lumenal geometries showing the regions occupied by thrombus.
Figure 5
Figure 5
Flow streamlines showing regions of slow, recirculating flow in 3 basilar aneurysms. Top row: streamlines at peak systole; bottom row: streamlines at the end of diastole.
Figure 6
Figure 6
Co-registration of lumenal surfaces obtained from MRA prior to thrombus formation (gray) and after thrombus formation (blue) with velocity iso-surfaces predicted by Newtonian flow simulations (red). Top row: peak systole; bottom row: end diastole.
Figure 7
Figure 7
Co-registration of lumenal surfaces obtained from MRA prior to thrombus formation (gray) and after thrombus formation (blue) with velocity iso-surface predicted by non-Newtonian flow simulations (red). Top row: peak systole; bottom row: end diastole.
Figure 8
Figure 8
Space-averaged velocity changes through the cardiac cycle calculated using the base-line geometry for regions that remained patent and those that were occupied by thrombus in the follow up geometry. Solid and dashed lines correspond to Newtonian and non-Newtonian results respectively.
Figure 9
Figure 9
Distribution of maximum shear calculated from Newtonian flow simulations. Cross-sectional planes show low maximum shear in the regions that were occupied by thrombus in the follow-up geometry.
Figure 10
Figure 10
Space-averaged “maximum shear” changes during the cardiac cycle calculated in the base-line geometry for regions remained patent and occupied by thrombus in the follow up geometry. Solid and dashed lines correspond to Newtonian and non-Newtonian results respectively.

Similar articles

Cited by

References

    1. Burleson A, Strother C, Turitto V. Computer Modeling of Intracranial Saccular and Lateral Aneurysms for the Study of Their Hemodynamics. Neurosurgery. 1995;37(4):774–84. - PubMed
    1. Castro MA, Putman CM, Cebral JR. Computational Fluid Dynamics Modeling of Intracranial Aneurysms: Effects of Parent Artery Segmentation on Intra-Aneurysmal Hemodynamics. American Journal of Neuroradiology. 2006;27:1703–1709. - PMC - PubMed
    1. Cebral JR, Castro MA, Appanaboyina S, et al. Efficient Pipeline for Image-based Patient-specific Analysis of Cerebral Aneurysm Hemodynamics: Technique and Sensitivity. IEEE Transaction on Medical Imaging. 2005;24(4):457–467. - PubMed
    1. Chaturani P, Samy RP. A study of non-Newtonian aspects of blood flow through stenosed arteries and its applications in arterial diseases. Biorheology. 1985;22:521–531. - PubMed
    1. Choi HW, Barakat AI. Numerical study of the impact of non-Newtonian blood behavior on flow over a two-dimensional backward facing step. Biorheology. 2005;42:493– 509. - PubMed

MeSH terms