. 2008 Sep 12:6:25.
doi: 10.1186/1477-5956-6-25.

A simple and reliable protocol for mouse serum proteome profiling studies by use of two-dimensional electrophoresis and MALDI TOF/TOF mass spectrometry

Affiliations

A simple and reliable protocol for mouse serum proteome profiling studies by use of two-dimensional electrophoresis and MALDI TOF/TOF mass spectrometry

Maria Stella Ritorto et al. Proteome Sci. .

Abstract

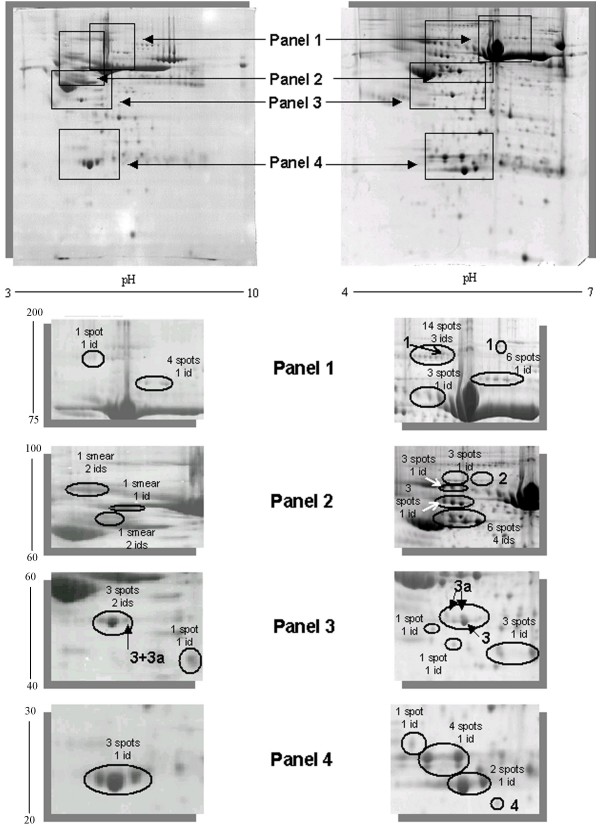
Background: Unravelling the serum proteome is the subject of intensified research. In this regard, two-dimensional electrophoresis coupled with MALDI MS analysis is still one of the most commonly used method. Despite some improvements, there is the need for better protocols to enable comprehensive identification of serum proteins.Here we report a combination of two proteomic strategies, zoom in acidic and neutral part of 2-D gels and an application of two optimised matrix preparations for MALDI-MS analyses to simplify serum proteome mapping.

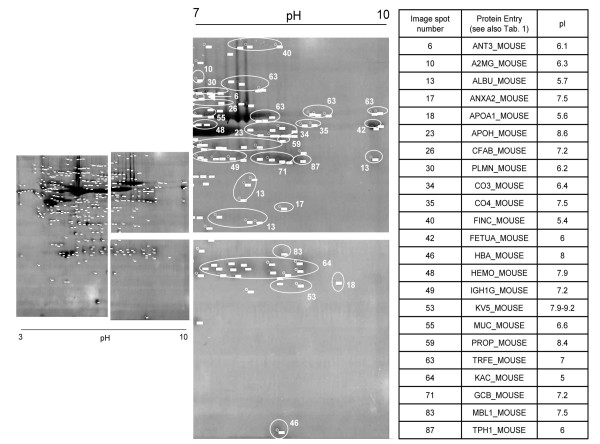
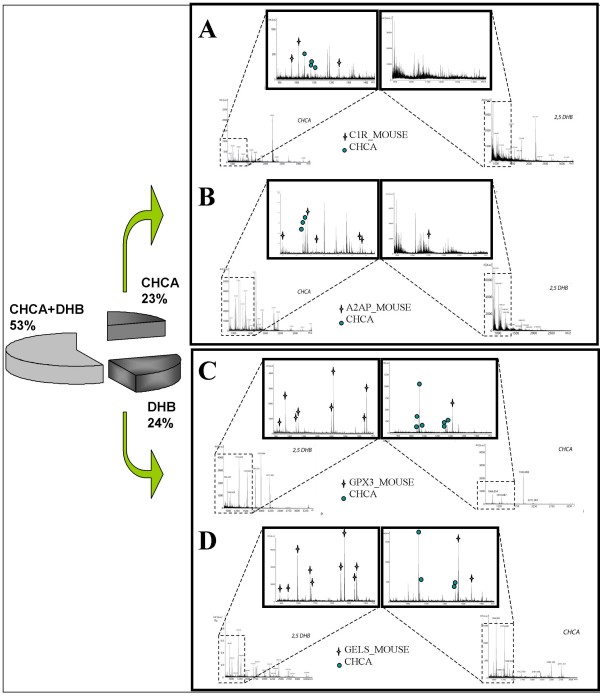
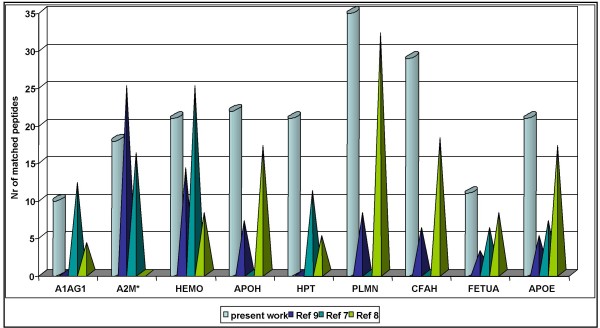
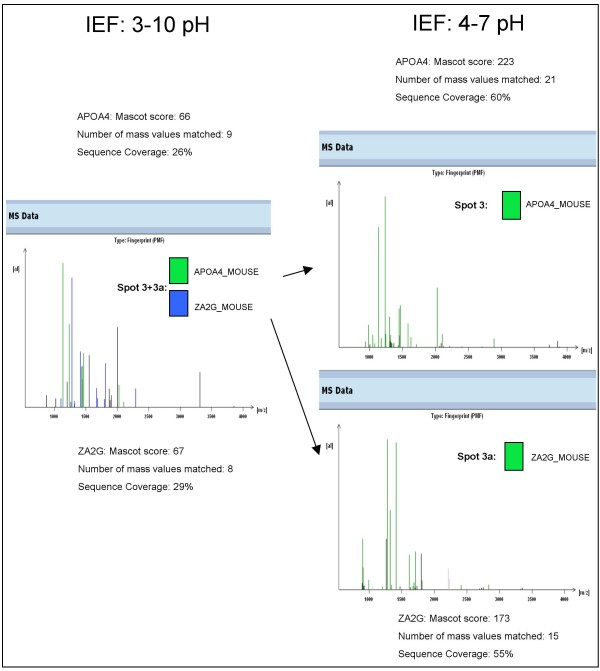
Results: Mouse serum proteins were separated by 2-D electrophoresis at the pH ranges 3-10 and 4-7, respectively. Then in gel tryptic digests were analysed by MALDI-MS. Notably, sample-matrix preparations consisted of either a thin-layer alpha-ciano-4-hydroxycinnamic acid (CHCA) matrix deposition or a matrix-layer 2,5-dihydroxybenzoic acid (DHB). This enabled an identification of 90 proteins. The herein reported method enhanced identification of proteins by 32% when compared with previously published studies of mouse serum proteins, using the same approaches. Furthermore, experimental improvements of matrix preparations enabled automatic identification of mouse proteins, even when one of the two matrices failed.

Conclusion: We report a simple and reliable protocol for serum proteome analysis that combines an optimized resolution of 2-D gels spots and improved sample-matrix preparations for MALDI-MS analysis. The protocol allowed automated data acquisition for both CHCA and DHB and simplified the MS data acquisition therefore avoiding time-consuming procedures. The simplicity and reliability of the developed protocol may be applied universally.


Figures

Figure 1
Figure 1
Protein entries at basic region of 3–10 pH range. An amount of 23 proteins were identified at basic region of gels at pH range 3–10. As discussed in the text, most of those proteins could be relevant in biomarker discovery research because of their involvement in inflammation or in mechanisms that could bring toward the development of cancer.
Figure 2
Figure 2
Improved resolution with zoom-in 2-D gels. Details of the 2-D gel zoomed areas. We showed the improved separation and visualization of the mouse serum proteome. In fact, multiple isoforms for most identified proteins were found and other identified spots were detected only in 4–7 pH-range and not in 3–10 pH-range. Panel 1: 3–10 pH range (1 spot 1 id: mouse ceruloplasmin; 4 spots 1 id: mouse gelsolin) 4–7 pH range (14 spots 3 ids: mouse ceruloplasmin, mouse alpha-macroglobulin, mouse albumin; 6 spots 1 id: mouse gelsolin; 3 spots 1 id: mouse hemopexin).Panel 2: 3–10 pH range (1 smear 2 ids: mouse afamin and mouse hemopexin; 1 smear 1 id: mouse kininogen; 1 smear 2 ids: mouse antithrombin-III, mouse Alpha-2-HS-glycoprotein) 4–7 pH range (3 spots 1 id: mouse prothrombin; 3 spots 1 Id: mouse hemopexin; 3 spots 1 id: mouse kininogen; 6 spots 4 ids: mouse antithrombin-III, mouse Alpha-2-HS-glycoprotein, mouse vitamin D-binding protein and mouse fetuin-b).Panel 3: 3–10 pH range (3 spots 2 ids: mouse apolipoprotein A4 and mouse zinc-alpha-2-glycoprotein; 1 spot 1 id: mouse albumin) 4–7 pH range (1 spot 1 id: mouse serum paraoxonase/arylesterase 1; 1 spot 1 id: mouse H-2 class I histocompatibility antigen; 3 spots 1 id: mouse alpha-2-macroglobulin). Panel 4: 3–10 pH range (3 spots 1 id: mouse apolipoprotein A1) 4–7 pH range (1 spot 1 id: mouse mannose-binding protein2; 4 spots 1 id: mouse Ig kappa chain V-III region; 2 spots 1 id: mouse apolipoprotein A2). The spots 1 (alpha-2-macroglobulin); 2 (complement C1r-subcomponent); 3 and 3a (Apoliprotein A4 and Zinc-alpha-glycoprotein 2 respectively) and 4 (glutathione peroxidase 3) are examples discussed respectively in the text and in Figure 5.
Figure 3
Figure 3
Spectra comparisons between CHCA and DHB. (A, B) CHCA matrix vs DHB matrix. Considerably, in the case of DHB the peptide ions signals are less resolved than other signals in the spectrum, maybe connected to metastable decay of ions in the drift tube or "chemical noises" from matrix ions. On the other hand, CHCA was enabled to identify complement C1r-subcomponent (C1r_MOUSE) and alpha-2-antiplasmin (A2AP_MOUSE). Crosses represent matched peptides to the identification. (C, D) DHB matrix vs CHCA matrix. The spectra from DHB are notably rich of peptides ions fragments (crosses) which belong to the identification, i.e. glutatione peroxidase-secreted form (GPX3_MOUSE) and gelsolin (GELS_MOUSE). The blue circles on CHCA spectra, instead, represent matrix fragments which hide the peaks could be matched to the identifications. The pie chart represents our mouse proteome mapping, where both matrices have the almost same input in the identifications.
Figure 4
Figure 4
Comparison of matched peptides. We have depicted here a comparison of some identification (x-axis) from our work (azure-cylinder) and three different mouse serum maps (prisms) [see ref [9,7,8]]. Note the number of matched peptides (y-axis) is higher or comparable with the pre-fractionation methods. Mouse protein identifications: A1AG1: alpha-1-acid glycoprotein, A2M: alpha-2-macroglobulin, HEMO: hemopexin, APOH: beta-2-glycoprotein 1, HPT: haptoglobin, PLMN: plasminogen, CFAH: complement factor H, FETUA: alpha-2-HS-glycoprotein-Fetuin-A, APOE: apoliproteinE.
Figure 5
Figure 5
Fast and reliable identification of mouse serum proteins. We have depicted here an example of improvement of data acquisition by the use narrow-pH IPG strips for the IEF. The data of score and matched peptides were chosen from the best outcome in MALDI-MS analysis by both matrices (CHCA and DHB) (ProteinScape™ database).

References

    1. Cho SY, Lee EY, Lee JS, Kim HY, Park JM, Kwon MS, Park YK, Lee HJ, Kang MJ, Kim JY, Yoo JS, Park SJ, Cho JW, Kim HS, Paik YK. Efficient prefractionation of low-abundance proteins in human plasma and construction of a two-dimensional map. Proteomics. 2005;5:3386–96. doi: 10.1002/pmic.200401310. - DOI - PubMed
    1. Molina H, Bunkenborg J, Reddy GH, Muthusamy B, Scheel PJ, Pandey A. A proteomic analysis of human hemodialysis fluid. Mol Cell Proteomics. 2005;4:637–50. doi: 10.1074/mcp.M500042-MCP200. - DOI - PubMed
    1. Anderson NL, Anderson NG. The human plasma proteome: history, character, and diagnostic prospects. Mol Cell Proteomics. 2002;1:845–867. doi: 10.1074/mcp.R200007-MCP200. - DOI - PubMed
    1. Anderson NL, Polanski M, Pieper R, Gatlin T, Tirumalai RS, Conrads TP, Veenstra TD, Adkins JN, Pounds JG, Fagan R, Lobley A. The human plasma proteome: a nonredundant list developed by combination of four separate sources. Mol Cell Proteomics. 2004;3:311–326. doi: 10.1074/mcp.M300127-MCP200. - DOI - PubMed
    1. Lai KK, Kolippakkam D, Beretta L. Comprehensive and quantitative proteome profiling of the mouse liver and plasma. Hepatology. 2008;3:1043–51. doi: 10.1002/hep.22123. - DOI - PubMed

LinkOut - more resources