. 2009 Jan;29(1):129-37.
doi: 10.1016/j.gaitpost.2008.07.010. Epub 2008 Sep 11.

Capacity to increase walking speed is limited by impaired hip and ankle power generation in lower functioning persons post-stroke

Affiliations

Capacity to increase walking speed is limited by impaired hip and ankle power generation in lower functioning persons post-stroke

I Jonkers et al. Gait Posture. 2009 Jan.

Abstract

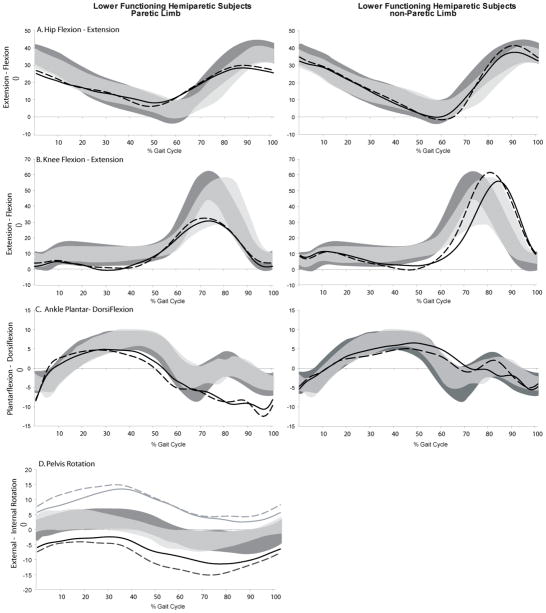
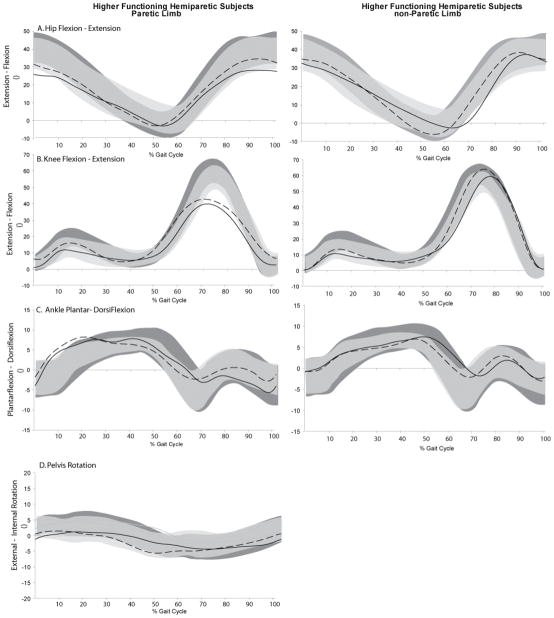
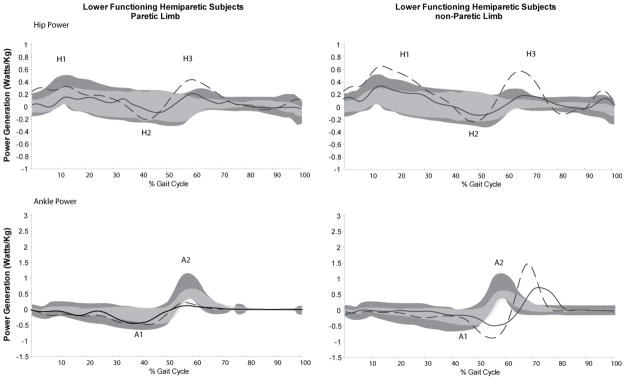
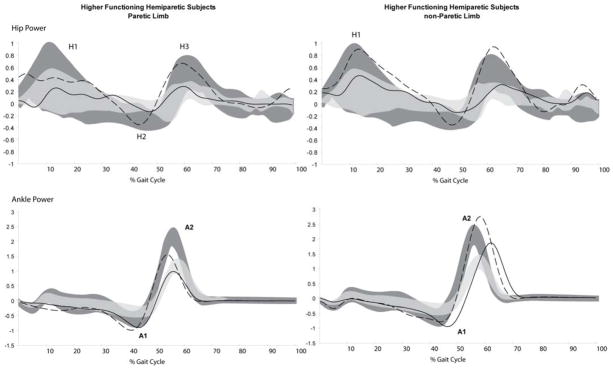
It is well known that stroke patients walk with reduced speed, but their potential to increase walking speed can also be impaired and has not been thoroughly investigated. We hypothesized that failure to effectively recruit both hip flexor and ankle plantarflexor muscles of the paretic side limits the potential to increase walking speed in lower functioning hemiparetic subjects. To test this hypothesis, we measured gait kinematics and kinetics of 12 persons with hemiparesis following stroke at self-selected and fast walking conditions. Two groups were identified: (1) lower functioning subjects (n=6) who increased normalized walking speed from 0.52 leg lengths/s (ll/s, SEM: 0.04) to 0.72 ll/s (SEM: 0.03) and (2) higher functioning subjects (n=6) who increased walking speed from 0.88 ll/s (SEM: 0.04) to 1.4 ll/s (SEM 0.03). Changes in spatiotemporal parameters, joint kinematics and kinetics between self-selected and fast walking were compared to control subjects examined at matched walking speeds (0.35 ll/s (SEM: 0.03), 0.63 ll/s (SEM: 0.03), 0.92 ll/s (SEM: 0.04) and 1.4 ll/s (SEM: 0.04)). Similar to speed-matched controls, the higher functioning hemiparetic subjects increased paretic limb hip flexion power and ankle plantarflexion power to increase walking speed. The lower functioning hemiparetic subjects did not increase power generation at the hip or ankle to increase walking speed. This observation suggests that impaired ankle power generation combined with saturation of hip power generation limits the potential to increase walking speed in lower functioning hemiparetic subjects.


Figures

Figure 1
Figure 1
A: Sagittal plane joint kinematics of hip, knee and ankle for the lower functioning stroke subjects walking at self-selected (solid) and fast speed (dashed) with superposition of the relevant speed related controls (Average ± Stdev, slow speed is indicated in light grey – fast speed in dark gray); Pelvis rotation (paretic side in dark – non-paretic side in grey) in lower functioning hemiparetic subjects walking at self-selected (solid) and fast (dashed) walking speed as compared to speed matched controls (Average ± Stdev, slow speed is indicated in light grey – fast speed in dark gray) Figure 1B: Sagittal plane joint kinematics of hip, knee and ankle for the higher functioning stroke subjects walking at self-selected (solid) and fast speed (dashed) with superposition of the relevant speed related controls (Average ± Stdev, slow speed is indicated in light grey – fast speed in dark gray); Pelvis rotation (paretic side in dark – non-paretic side in grey) in higher functioning hemiparetic subjects walking at self-selected (solid) and fast (dashed) walking speed as compared to speed matched controls (Average ± Stdev, slow speed is indicated in light grey – fast speed in dark gray)
Figure 1
Figure 1
A: Sagittal plane joint kinematics of hip, knee and ankle for the lower functioning stroke subjects walking at self-selected (solid) and fast speed (dashed) with superposition of the relevant speed related controls (Average ± Stdev, slow speed is indicated in light grey – fast speed in dark gray); Pelvis rotation (paretic side in dark – non-paretic side in grey) in lower functioning hemiparetic subjects walking at self-selected (solid) and fast (dashed) walking speed as compared to speed matched controls (Average ± Stdev, slow speed is indicated in light grey – fast speed in dark gray) Figure 1B: Sagittal plane joint kinematics of hip, knee and ankle for the higher functioning stroke subjects walking at self-selected (solid) and fast speed (dashed) with superposition of the relevant speed related controls (Average ± Stdev, slow speed is indicated in light grey – fast speed in dark gray); Pelvis rotation (paretic side in dark – non-paretic side in grey) in higher functioning hemiparetic subjects walking at self-selected (solid) and fast (dashed) walking speed as compared to speed matched controls (Average ± Stdev, slow speed is indicated in light grey – fast speed in dark gray)
Figure 2
Figure 2
A: Joint power at hip and ankle for the lower functioning hemiparetic subjects walking at self-selected (solid) and fast speed (dashed) compared controls walking at relevant speeds (Average ± Stdev) with superposition of the relevant speed related controls (Average ± Stdev, slow speed is indicated in light grey – fast speed in dark gray); Figure 2B: Joint power at hip and ankle for the higher functioning hemiparetic subjects walking at self-selected (solid) and fast speed (dashed) compared controls walking at relevant speeds (Average ± Stdev) with superposition of the relevant speed related controls (Average ± Stdev, slow speed is indicated in light grey – fast speed in dark gray);
Figure 2
Figure 2
A: Joint power at hip and ankle for the lower functioning hemiparetic subjects walking at self-selected (solid) and fast speed (dashed) compared controls walking at relevant speeds (Average ± Stdev) with superposition of the relevant speed related controls (Average ± Stdev, slow speed is indicated in light grey – fast speed in dark gray); Figure 2B: Joint power at hip and ankle for the higher functioning hemiparetic subjects walking at self-selected (solid) and fast speed (dashed) compared controls walking at relevant speeds (Average ± Stdev) with superposition of the relevant speed related controls (Average ± Stdev, slow speed is indicated in light grey – fast speed in dark gray);

Similar articles

Cited by

References

    1. Bohannon RW. Gait performance of hemiparetic stroke patients: selected variables. Arch Phys Med Rehabil. 1987;68(11):777–781. - PubMed
    1. Brandstatter ME, de Bruin H, Gowland C, Clark BM. Hemiplegic gait. Analysis of temporal variables. Arch Phys Med Rehabil. 1983;64(12):583–587. - PubMed
    1. Hsu AL, Tang PF, Jan MH. Analysis of impairments influencing gait velocity and asymmetry of hemiplegic patients after mild to moderate stroke. Arch Phys Med Rehabil. 2003;84(8):1185–1193. - PubMed
    1. Nadeau S, Arsenault AB, Gravel D, Bourbonnais D. Analysis of the clinical factors determining natural and maximal gait speeds in adults with a stroke. Am J Phys Med Rehabil. 1999;78(2):123–130. - PubMed
    1. Bohannon RW. Strength of lower limb related to gait velocity and cadence in stroke subjects. Physiother Canada. 1986;38(4):204–206.

Publication types