. 2008 Dec 1;45(11):1501-9.
doi: 10.1016/j.freeradbiomed.2008.08.009. Epub 2008 Aug 14.

Late ROS accumulation and radiosensitivity in SOD1-overexpressing human glioma cells

Affiliations

Late ROS accumulation and radiosensitivity in SOD1-overexpressing human glioma cells

Zhen Gao et al. Free Radic Biol Med. .

Abstract

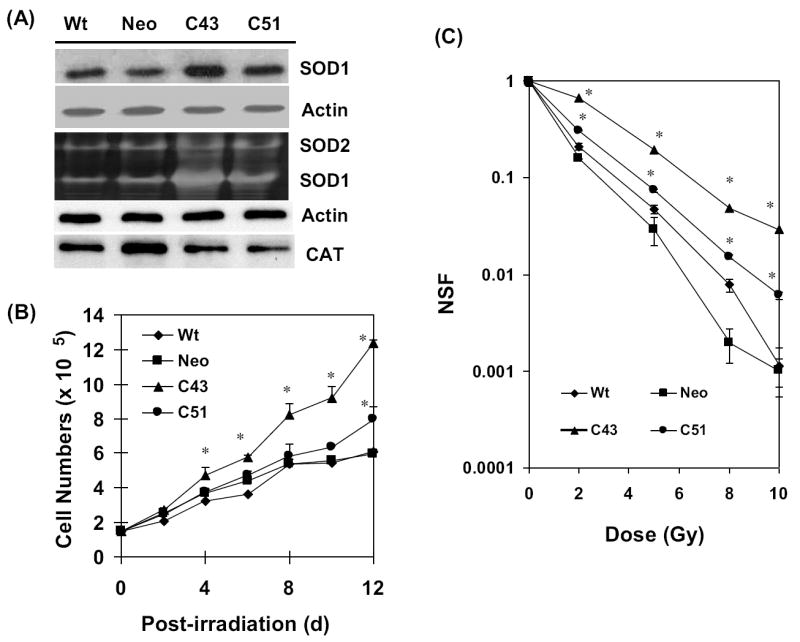
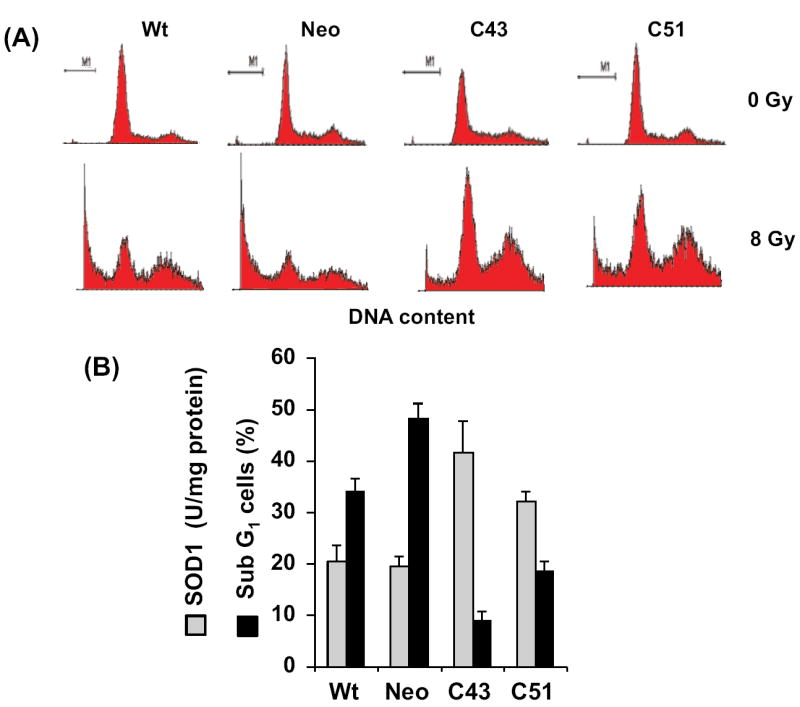
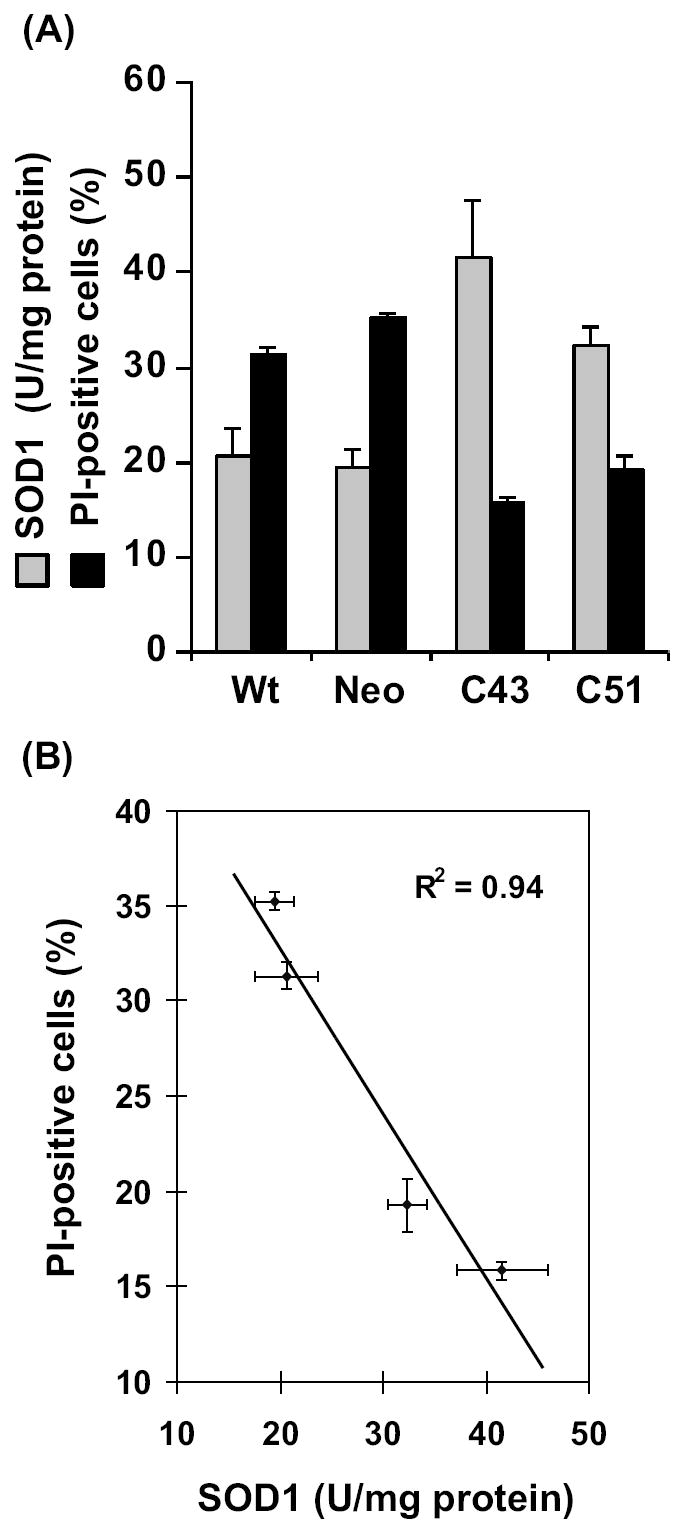
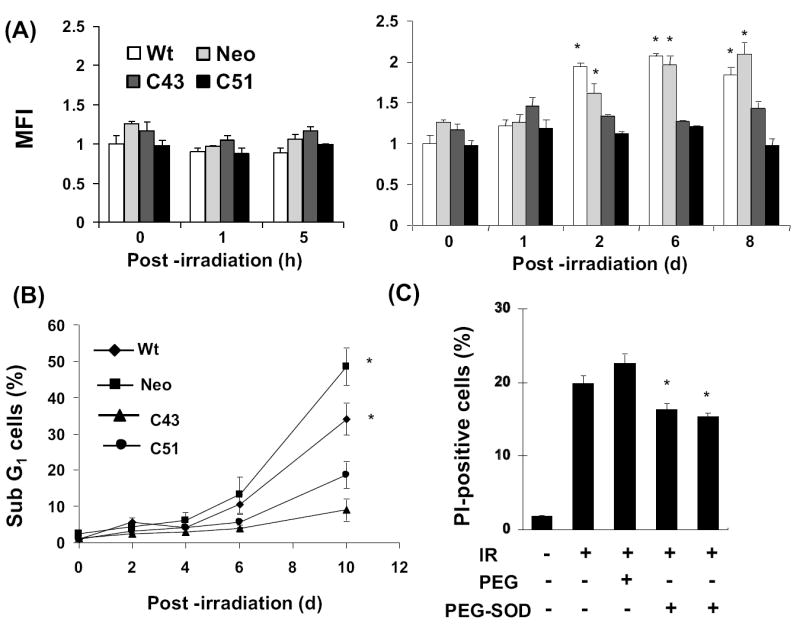
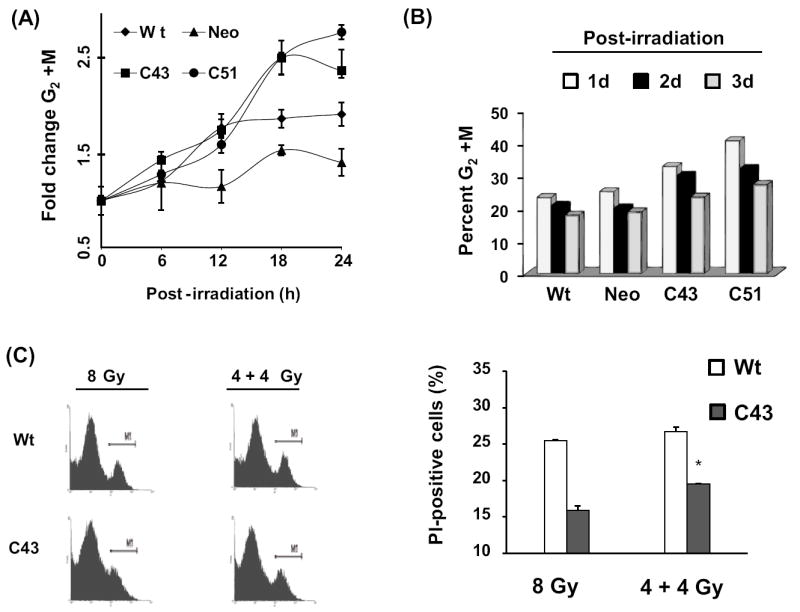
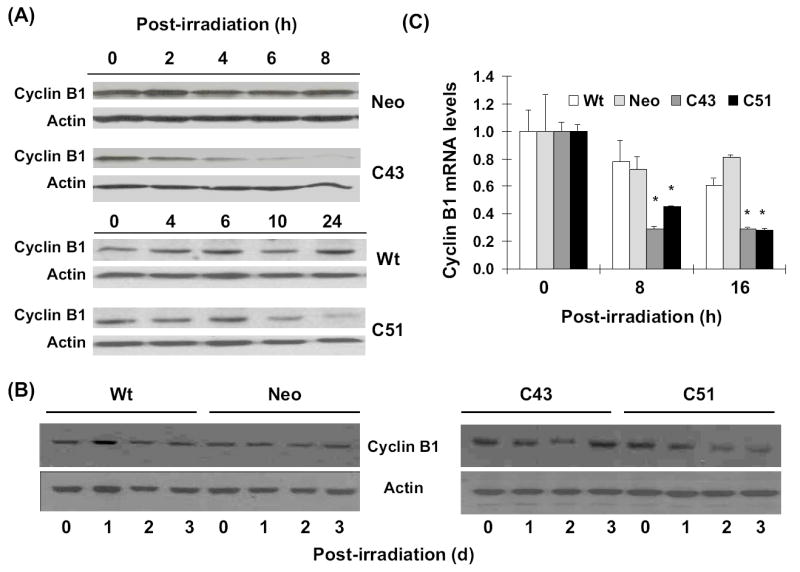
This study investigates the hypothesis that CuZn superoxide dismutase (SOD1) overexpression confers radioresistance to human glioma cells by regulating the late accumulation of reactive oxygen species (ROS) and the G(2)/M-checkpoint pathway. U118-9 human glioma cells (wild type, neo vector control, and stably overexpressing SOD1) were irradiated (0-10 Gy) and assayed for cell survival, cellular ROS levels, cell-cycle-phase distributions, and cyclin B1 expression. SOD1-overexpressing cells were radioresistant compared to wild-type (wt) and neo vector control (neo) cells. Irradiated wt and neo cells showed a significant increase (approximately twofold) in DHE fluorescence beginning at 2 days postirradiation, which remained elevated at 8 days postirradiation. Interestingly, the late accumulation of ROS was suppressed in irradiated SOD1-overexpressing cells. The increase in ROS levels was followed by a decrease in cell growth and viability and an increase in the percentage of cells with sub-G(1) DNA content. SOD1 overexpression enhanced radiation-induced G(2) accumulation within 24 h postirradiation, which was accompanied by a decrease in cyclin B1 mRNA and protein levels. These results support the hypothesis that long after radiation exposure a "metabolic redox response" regulates radiosensitivity of human glioma cells.


Figures

Figure 1
Figure 1. Radioresistance in SOD1 overexpressing human glioma cells
(A) Total cellular proteins were extracted from exponential cultures of wt, neo, and SOD1 overexpressing (C43 and C51) human glioma cells. Equal amounts of proteins were separated by SDS-PAGE and immunoblotted for SOD1, catalase, and actin protein levels; SOD1 and SOD2 activities were measured by native gel-electrophoresis. (B) Exponentially growing cultures were irradiated with 8 Gy (dose rate: 0.83 Gy/min) and analyzed for cell growth by counting cells in a Z1 Coulter Counter (Beckman Coulter). (C) Control (0 Gy) and irradiated (2-10 Gy) cells were assayed for cell survival using clonogenic assay. Monolayer cultures were trypsinized and re-plated at limited dilutions. Cells were cultured for 15 d and stained with 0.8% coomassie blue G250 dissolved in 50% methanol and 20% acetic acid. The surviving colonies of cells containing 50 or more cells were scored. NSF: normalized survival fraction. Asterisks represent statistical significance compared to wt and neo controls; error bars represent average and SD; n=3, p<0.05.
Figure 2
Figure 2. SOD1 overexpression suppressed radiation-induced increase in the percentage of cells with sub G1-DNA content
(A) Representative histograms of unirradiated and irradiated cells: asynchronous cultures were irradiated with 8 Gy and harvested 10 d post-irradiation. Ethanol-fixed cells were analyzed for DNA content by flow cytometry. (B) Basal levels of SOD1 activity and the percentage of cells with DNA content less than G1 (sub G1, indicative of cell death); SOD1 activity was measured by the biochemical activity assay.
Figure 3
Figure 3. Radiation induced increase in percent propidium-iodide positive cells inversely correlates with SOD1 activity
(A) Flow cytometry assay of cell viability: Exponential cultures were irradiated with 8 Gy and harvested by trypsinizing the monolayer cultures at 8 d post-irradiation. Cells were stained with PI and PI-stained cell population analyzed by flow cytometry. SOD1 activity was measured by the biochemical activity assay. (B) A correlation plot of SOD1 activity and percent PI-positive cells.
Figure 4
Figure 4. SOD1 overexpression-induced radioresistance correlates with inhibition in the late accumulation of reactive oxygen species (ROS)
(A) Flow cytometry assay of cellular ROS levels: exponentially growing asynchronous cultures of wt, neo, and SOD1 overexpressing (C43 and C51) cells were irradiated with 8 Gy and continued in culture. Monolayers were stained with 10 μM dihydroethidium (DHE) and harvested by trypsinizing the monolayer cultures. DHE-fluorescence analyzed by flow cytometry. The fold-change in mean fluorescence intensity (MFI) was calculated relative to unirradiated wt cells. Asterisks represent statistical significance compared to 0 h; p<0.05. (B) Cells from replicate dishes were fixed in ethanol, and ethanol-fixed cells were analyzed for DNA content by flow cytometry. The percentage of cells with sub G1-DNA content calculated using CellQuest software. (C) Exponentially growing asynchronous neo cultures were pre- (10 h) or post (5 h)-treated with 400 U of PEG-SOD and irradiated with 4 Gy. Cells were stained with PI at 6 d post-irradiation and the percentage of PI-positive cells analyzed by flow cytometry. Cells treated with PEG alone were included to show specificity of SOD1 activity. Asterisks represent statistical significance compared to irradiated neo cells; error bars represent average and SD; n=3, p<0.05.
Figure 5
Figure 5. SOD1 overexpression enhanced radiation-induced G2-accumulation
(A) Exponentially growing asynchronous cultures were irradiated with 8 Gy and harvested at indicated times for flow cytometry measurements of DNA content. Cell cycle phase distributions were calculated using MODFIT software; fold-change was calculated relative to 0 h un-irradiated cells. The percentage of G2/M in un-irradiated cells was as follows: wt, 12%; neo, 18%; C43, 14%; C51, 14%. (B) Irradiated cells were continued in culture and harvested at 1, 2, and 3 d post-irradiation for cell cycle phase analysis. The percent distributions in G2/M in wt, neo, C43, and C51 were calculated. (C) Asynchronously growing exponential cultures of wt and C43 cells were irradiated with a single dose of 8 Gy or split dose of 4+4 Gy. In the split dose experiment, the time difference between the two doses was 18 h. Cells were continued in culture and harvested at 6 d post-irradiation for flow cytometry measurements of cell viability. Error bars represent average and SD; n=3, p<0.05.
Figure 6
Figure 6. SOD1 overexpression down-regulated cyclin B1 mRNA and protein levels
Total cellular proteins isolated at the indicated times were separated by SDS-PAGE and immunoblotted for cyclin B1 protein levels at 0-24 h (A), and 0-3 d (B) post-irradiation; actin protein levels were used for loading correction. (C) Quantitative RT-PCR assay for measurements of cyclin B1 mRNA levels: cellular RNA was extracted using TRIzol reagent (Invitrogen). Total mRNA was reverse transcribed (High Capacity cDNA Achieve Kit, ABI) and quantitative PCR performed using SYBR Green Quantitative PCR kit and ABI PRISM 7000 sequence detection system. Relative cyclin B1 mRNA level was calculated and fold-change plotted relative to 0 h un-irradiated cells.

References

    1. Valko M, Rhodes CJ, Moncol J, Izakovic M, Mazur M. Free radicals, metals and antioxidants in oxidative stress-induced cancer. Chem Biol Interact. 2006;160:1–40. - PubMed
    1. Zelko IN, Mariani TJ, Folz RJ. Superoxide dismutase multigene family: a comparison of the CuZn-SOD (SOD1), Mn-SOD (SOD2), and EC-SOD (SOD3) gene structures, evolution, and expression. Free Radic Biol Med. 2002;33:337–349. - PubMed
    1. Elchuri S, Oberley TD, Qi W, Eisenstein RS, Jackson Roberts L, Van Remmen H, Epstein CJ, Huang TT. CuZnSOD deficiency leads to persistent and widespread oxidative damage and hepatocarcinogenesis later in life. Oncogene. 2005;24:367–380. - PubMed
    1. Folz RJ, Crapo JD. Extracellular superoxide dismutase (SOD3): tissue-specific expression, genomic characterization, and computer-assisted sequence analysis of the human EC SOD gene. Genomics. 1994;22:162–171. - PubMed
    1. McCord JM, Fridovich I. Superoxide dismutase. An enzymic function for erythrocuprein (hemocuprein) J Biol Chem. 1969;244:6049–6055. - PubMed

Publication types

MeSH terms