. 2008 Sep;20(9):2339-56.
doi: 10.1105/tpc.108.059618. Epub 2008 Sep 12.

Chloroplast signaling and LESION SIMULATING DISEASE1 regulate crosstalk between light acclimation and immunity in Arabidopsis

Affiliations

Chloroplast signaling and LESION SIMULATING DISEASE1 regulate crosstalk between light acclimation and immunity in Arabidopsis

Per Mühlenbock et al. Plant Cell. 2008 Sep.

Erratum in

  • Plant Cell. 2008 Dec;20(12):3480. Mateo, Alfonso [added]

Abstract

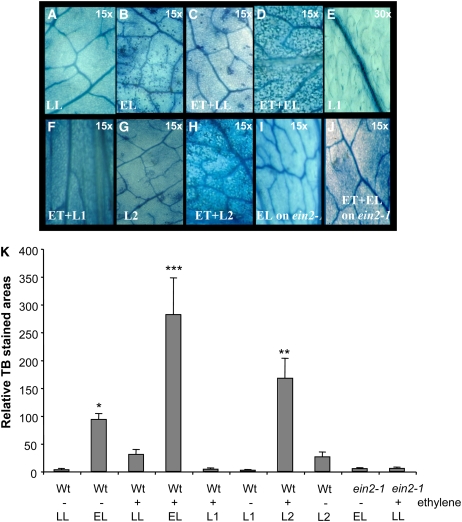
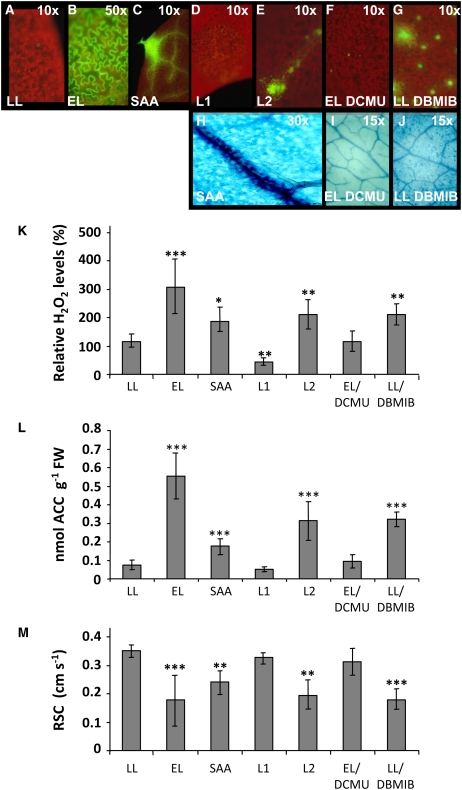
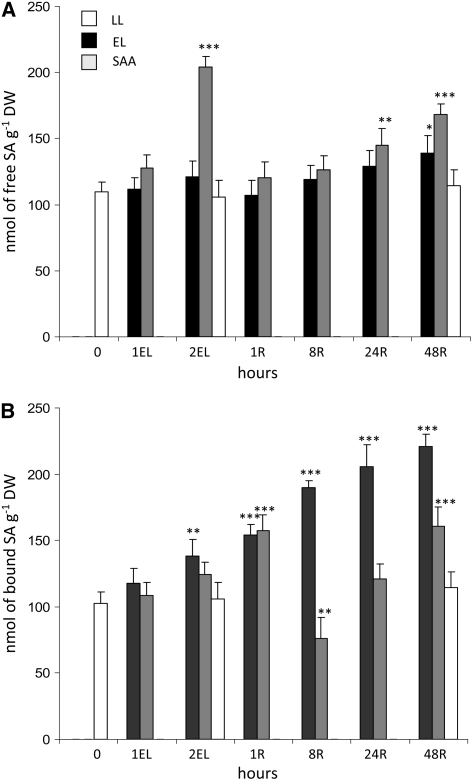
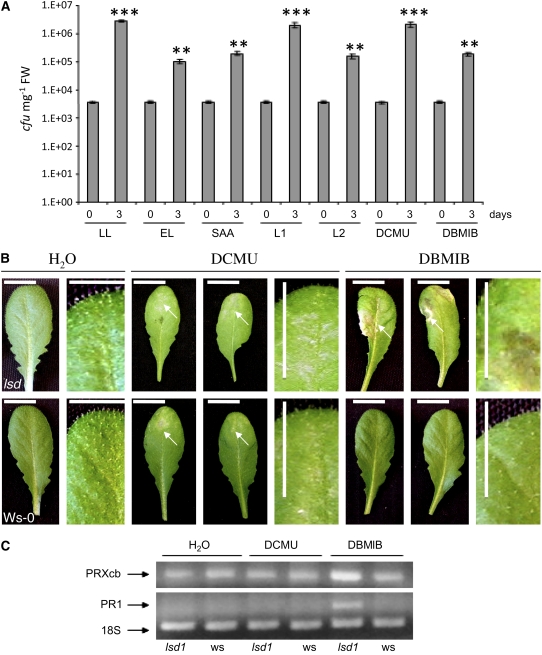
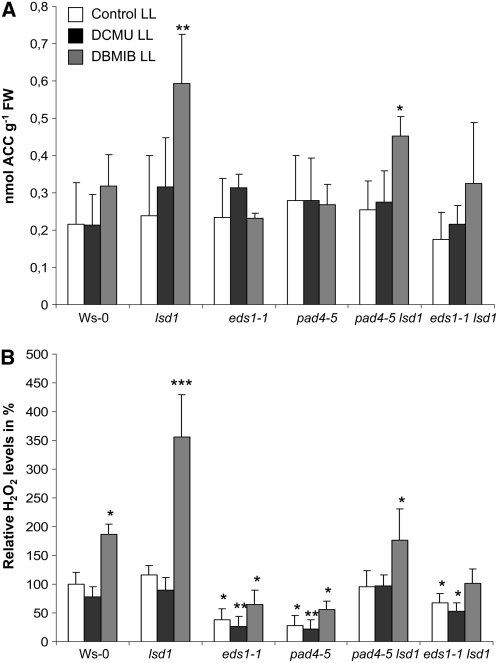
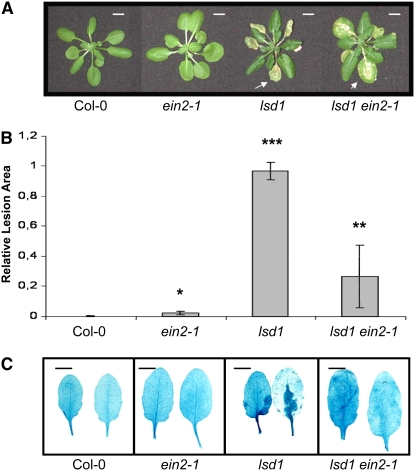
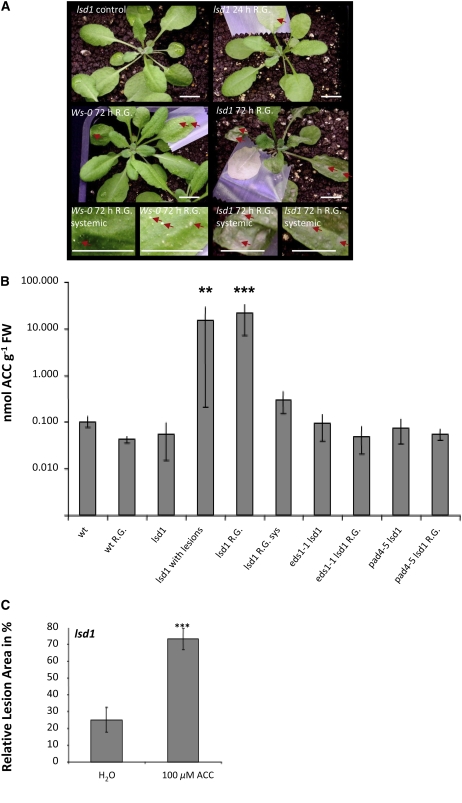
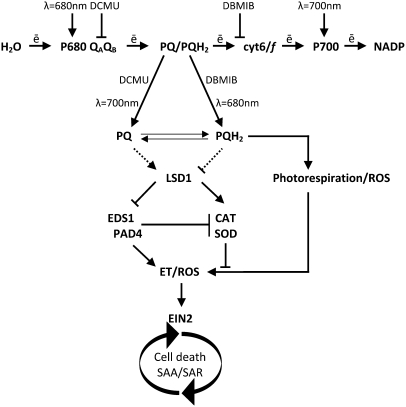
Plants are simultaneously exposed to abiotic and biotic hazards. Here, we show that local and systemic acclimation in Arabidopsis thaliana leaves in response to excess excitation energy (EEE) is associated with cell death and is regulated by specific redox changes of the plastoquinone (PQ) pool. These redox changes cause a rapid decrease of stomatal conductance, global induction of ASCORBATE PEROXIDASE2 and PATHOGEN RESISTANCE1, and increased production of reactive oxygen species (ROS) and ethylene that signals through ETHYLENE INSENSITIVE2 (EIN2). We provide evidence that multiple hormonal/ROS signaling pathways regulate the plant's response to EEE and that EEE stimulates systemic acquired resistance and basal defenses to virulent biotrophic bacteria. In the Arabidopsis LESION SIMULATING DISEASE1 (lsd1) null mutant that is deregulated for EEE acclimation responses, propagation of EEE-induced programmed cell death depends on the plant defense regulators ENHANCED DISEASE SUSCEPTIBILITY1 (EDS1) and PHYTOALEXIN DEFICIENT4 (PAD4). We find that EDS1 and PAD4 operate upstream of ethylene and ROS production in the EEE response. The data suggest that the balanced activities of LSD1, EDS1, PAD4, and EIN2 regulate signaling of programmed cell death, light acclimation, and holistic defense responses that are initiated, at least in part, by redox changes of the PQ pool.


Figures

Figure 1.
Figure 1.
Plant Programmed Cell Death in Response to Excess Light Is Modulated by Redox Status of the PQ Pool. (A) to (J) TB staining of Col-0 leaves after low light (LL; 100 ± 20 μmol photons m−2 s−1) (A), 1 h of excess light (EL; 2200 ± 200 μmol m−2 s−1) (B), fumigated with 7.5 ppb ethylene for 24 h in LL (ET+LL) (C), fumigated with ethylene for 24 h and exposed to 1 h of EL (ET+EL) (D), or exposed to 4 h of light-1 (L1; enriched in 700-nm wavelength of energy of 10.24 J s−1 m−2) (E); Col-0 leaves fumigated with ethylene for 24 h and then exposed to L1 (ET+L1) (F); leaves exposed to light-2 (L2; enriched in 680-nm wavelength of energy of 10.24 J s−1 m−2) (G) or fumigated for 24 h with ethylene and exposed to 4 h of L2 (ET+L2) (H); leaves of the ethylene insensitive 2-1 null mutant exposed to 1 h of EL (EL on ein2) (I); and leaves of the ein2-1 null mutant exposed to 24 h of ethylene and then to 1 h of EL (ET+EL on ein2-1) (J). Images are representative of at least 27 leaves per treatment from three independent experiments (n = 27). Magnification is as indicated on each image (×15 or ×30). (K) Areas of TB-stained foliar tissues in Col-0 and the ein2-1 null mutant cultivated in LL and then exposed to light and ethylene conditions as described in (A) to (J). Images are representative of at least nine leaves per treatment from three independent experiments (n = 3, n = 27 ± sd). Confidence levels were tested by a Student's t test (*, P < 0.05, **, P < 0.01; ***, P < 0.001). Ethylene fumigation (for 24 h) was performed directly before exposure to different light conditions, and fumigated samples are indicated by a plus sign. Samples receiving different light treatments only are indicated by a minus sign. Symbols for light treatment are the same as in (A) to (J). Only sporadic programmed cell death appears in ein1-2 and in L1 and ET+L1 conditions.
Figure 2.
Figure 2.
Plant Cellular ROS/Ethylene Homeostasis, Programmed Cell Death, and Stomatal Conductance Are Modulated by Redox Status of the PQ Pool. (A) to (J) Detection of hydrogen peroxide in leaves stained with 10 μM 2′,7′-dichlorofluorescin diacetate and visualized with fluorescence microscopy (10-, 30-, and 50-fold magnification). Dark-red color is derived from chlorophyll fluorescence, and green indicates peroxide. Leaves were either exposed to low light ([A]; 100 ± 20 μmol m−2 s−1) or to 1 h of excess light ([B]; 2200 ± 200 μmol m−2 s−1), were developing SAA (C) (Karpiński et al., 1999), were exposed to 4 h of light-1 (L1 enriched in 700-nm wavelength of energy of 10.24 J s−1 m−2) (D) or exposed to 4 h of light-2 (L2 enriched in 680-nm wavelength of energy of 10.24 J s−1 m−2) (F), treated with 8 μM of DCMU under LL conditions for 3 h and then exposed to 1 h EL ([G]; EL DCMU), or treated with 14 μM DBMIB under LL conditions for 4 h (LL DBMIB) (H). DBMIB and DCMU treatments caused an ∼20 and 40% reduction of photosynthetic electron transport, respectively, as indicated by chlorophyll a fluorescence parameters. Additionally, we show TB-stained Col-0 leaves that are developing SAA (I) (Karpiński et al., 1999), leaves treated with 8 μM DCMU under LL conditions for 3 h and then exposed to 1 h of EL ([J]; EL DCMU), and leaves treated with 14 μM DBMIB under LL conditions for 4 h ([K]; LL DBMIB). Images are representative of at least 19 leaves per treatment from three independent experiments. (K) to (M) Levels of foliar H2O2 (K), foliar ACC (nmol per g of fresh weight; [L]), and RSC (in comparison to control plants cultivated in LL; [M]) in Arabidopsis Col-0 leaves exposed to LL, after 1 h of exposure to EL, or during development of SAA (Karpiński et al., 1999), in leaves of a plant exposed to L1 or to L2, in leaves treated with 8 μM DCMU under LL conditions for 3 h and exposed to EL for 1 h, or in leaves treated with 14 μM DBMIB under LL conditions for 4 h. Data are representative of a triplicate sample of pooled leaves from four independent experiments (n = 4 ± sd). Confidence levels were tested by a Student's t test (*, P < 0.05; **, P < 0.01; ***, P < 0.001).
Figure 3.
Figure 3.
Free and Bound Foliar SA Is Specifically Induced in Post-Stress Recovery and Acclimation Response to Excess Light. Free (A) and bound (B) foliar SA levels, estimated in dry weight (DW) during 1 and 2 h of excess light (2200 ± 200 μmol photons m−2 s−1) and after 1, 8, 24, and 48 h of recovery in low light (100 ± 20 μmol photons m−2 s−1) measured in leaves directly exposed to EL and in leaves undergoing SAA in LL (systemic response) (Karpiński et al., 1999). Data are representative of pooled leaf samples from four independent experiments (n = 4 ± sd). Confidence levels were tested by a Student's t test (*, P < 0.01; **, P < 0.005; ***, P < 0.001).
Figure 4.
Figure 4.
Functional Categorization of Subtraction Suppressed Subtractive Hybridization EST Libraries. mRNA for these libraries was isolated from partially exposed rosettes, from leaves (local [LO]) directly exposed to 40 min of excess light (2200 ± 200 μmol photons m−2 s−1), and from leaves undergoing SAA (systemic [SY]) in low light (100 ± 20 μmol photons m−2 s−1) for 40 min (i.e., LO and SY leaf samples collected at the same time). List of all sequenced ESTs from these libraries is presented in Supplemental Data Set 1 online.
Figure 5.
Figure 5.
Redox Status of the PQ Pool Affects Defense against Virulent Biotrophic Bacteria Infection in Arabidopsis Leaves. (A) Growth of P. syringae pathovar DC3000 in infected Col-0 leaves 1 h and 0 d and 72 h and 3 d after infection and estimated in fresh weight (FW). Infections were made on leaves with various light acclimatory conditions and consequently changed the PQ redox status. Leaves before infection were acclimated to low light (control) (100 ± 20 μmol photons m−2 s−1), exposed for 1 h to excess light (2200 ± 200 μmol photons m−2 s−1), were developing SAA (Karpiński et al., 1999), or were exposed to 4 h of light-1 (L1 enriched in 700-nm wavelength of energy of 10.24 J s−1 m−2), exposed to 4 h of light-2 (L2 enriched in 680-nm wavelength of energy of 10.24 J s−1 m−2), treated with 8 μM of DCMU under LL conditions for 3 h and then exposed to 1 h EL, or treated with 14 μM DBMIB under LL conditions for 4 h. DBMIB and DCMU treatments caused an ∼20 and 40% reduction of photosynthetic electron transport, respectively, as indicated by chlorophyll a fluorescence parameters. Results represent three independent experiments and 15 infections per experiment and treatment (n = 45 ± sd). Confidence levels were tested in a Student's t test (*, P < 0.05; **, P < 0.01; ***, P < 0.001). cfu, colony-forming units. (B) Treatment of leaves with 8 μM DCMU in low light conditions (100 ± 20 μmol photons m−2 s−1) caused formation of discrete spots of chlorosis (indicated by arrows) in both Ws-0 and Ws lsd1. By contrast, application of 14 μM DBMIB under low light conditions induced spreading lesions only in Ws lsd1 (indicated by arrows) (n = 5 from two independent experiments, n = 2). Chlorosis in Ws-0 and in lsd1 was observed 24 h after DCMU, and runaway cell death in lsd1 mutants was also observed 24 h after DBMIB treatment. Bars = 1 cm. (C) Relative transcript levels of PRXcb and PR1 measured by RT-PCR (n = 4). Induction of PR1 transcript was detected 2 h after DBMIB treatment.
Figure 6.
Figure 6.
LSD1 and Redox Status of the PQ Pool Regulate Foliar Ethylene and H2O2 Levels. Foliar ACC (A) and foliar H2O2 (B) levels relative to those observed in control Ws-0 plants. ACC and H2O2 were measured in Ws-0, Ws-lsd1, Ws-eds1-1, and Ws-pad4-5 mutants and in Ws-pad4-5 lsd1 and Ws-eds1-1 lsd1 double mutants 4 h after treatment of leaves with 8 μM DCMU and 14 μM DBMIB under low light conditions (100 ± 20 μmol photons m−2 s−1). ACC and H2O2 were estimated in fresh weight (FW) of leaves. Data are representative of pooled leaf samples from four independent experiments (n = 4 ± sd). Confidence levels were tested by a Student's t test (*, P < 0.05; **, P < 0.01; ***, P < 0.001).
Figure 7.
Figure 7.
Dysfunction of EIN2 Partially Reverts Propagation of EEE-Induced Runaway Cell Death in lsd1. (A) Representative images of rosettes of Col-0, Col-ein2-1, Col-lsd1, and Col-lsd ein2-1 plants 72 h after artificially restricting gas exchange with smear of lanoline apply on adaxial side of a one leaf (R.G). Bars = 1 cm. (B) Lesion areas were measured relative to the control wild-type Col-0 (taken as zero or a few lesions) in leaves of Col-ein2-1, Col-lsd1, and Col-lsd ein2-1 plants 72 h after R.G. The lesion area (runaway cell death) was significantly reduced (restricted) in the lsd1 ein2-1 double mutant compared with the lsd1 single mutant. Confidence levels were tested by a Student's t test (n = 18 ± sd; *, P < 0.05; **, P < 0.01; ***, P < 0.001). (C) TB-stained Col-0, Col-ein2-1, Col-lsd1, and Col-lsd ein2 leaves after being exposed to photorespiratory conditions for 24 h (by R.G. with lanoline smear apply on adaxial side of a single leaf). Foliar chlorosis could be observed in the lsd1 ein2-1 double mutant, but they were not stained by TB, indicating that runaway cell death was restricted in the double mutant.
Figure 8.
Figure 8.
Photorespiratory Conditions in Single Rosette Leaves Induce an Ethylene Burst and Systemic Runaway Cell Death in the Ws-lsd1 Rosette. (A) R.G., obtained by applying semitransparent Scotch tape to the adaxial surface of a single leaf, induced local runaway cell death followed by systemic runaway cell death in older (red arrows), but not in younger, rosette leaves. In Ws-0 plants exposed to R.G., sporadic programmed cell death was observed in both the treated and in the oldest systemic leaves. The images are representative of 17 independent experiments. Similar effects were observed in Col-0 and in Col-lsd1 plants 24 h after R.G. was achieved by applying a smear of lanoline wax on the adaxial surface of a single leaf (see Supplemental Figure 2 online). Bars = 1 cm. (B) R.G. by applying a smear of lanoline wax on the adaxial surface of a leaf significantly induced foliar ACC production in Ws-lsd1 but not in wild-type (Ws-0) plants after 24 h of treatment. The eds1 lsd1 and pad4 lsd1 double mutants similarly to Ws-0 did not significantly induce ACC in the same treatments (one-way analysis of variance with Tukey-Kramer procedure; **, P < 0.01; ***, P < 0.001; n = 4 ± sd for each treatment). Similar R.G. treatment induced foliar ethylene emission (see Supplemental Figure 3 online). (C) Injection of 100 μM ACC solution into leaves induced runaway cell death after 48 h in Ws-lsd1 leaves. Compare with leaves injected with water (Student's t test; ***, P < 0.001; n = 24 ± sd).
Figure 9.
Figure 9.
Model for EEE-Induced Programmed Cell Death Controlled by the Chloroplast Redox Signaling, Photorespiration, and LSD1. The programmed cell death redox signaling mechanism initiated by redox changes in the PQ pool is regulated by LSD1 that acts to limit the spread of cell death. The regulatory mode of LSD1 suppresses ROS production from photorespiration (Mateo et al., 2004). PAD4- and EDS1-dependent cellular ethylene production, together with EIN2, modulate ethylene (ET)–induced programmed cell death signaling during acclimatory and biotrophic pathogen defense responses. LSD1 positively regulates, either directly or indirectly, superoxide dismutase (SOD) and catalase (CAT) gene expression and activities and thus controls cellular ROS production (Jabs et al., 1996; Kliebenstein et al., 1999; Mateo et al., 2004). We propose that LSD1, EDS1, and PAD4 constitute a ROS/ethylene homeostatic switch, controlling light acclimation (SAA) and pathogen defense (SAR) holistic responses.

References

    1. Adams, D.O., and Yang, S.F. (1979). Ethylene biosynthesis: Identification of 1-aminocyclopropane-1-carboxylic acid as an intermediate in the conversion of methionine to ethylene. Proc. Natl. Acad. Sci. USA 76 170–174. - PMC - PubMed
    1. Asada, K. (1999). The water-water cycle in chloroplasts: Scavenging of active oxygens and dissipation of excess photons. Annu. Rev. Plant Physiol. Plant Mol. Biol. 50 601–639. - PubMed
    1. Ball, L., Accotto, G.-P., Bechtold, U., Creissen, G., Funck, D., Jimenez, A., Kular, B., Leyland, N., Mejia-Carranza, J., Reynolds, H., Karpiński, S., and Mullineaux, P.M. (2004). Evidence for a direct link between glutathione biosynthesis and stress defense gene expression in Arabidopsis. Plant Cell 16 2448–2462. - PMC - PubMed
    1. Bartsch, M., Gobbato, E., Bednarek, P., Debey, S., Schultze, J.L., Bautor, J., and Parker, J.E. (2006). Salicylic acid-independent ENHANCED DISEASE SUSCEPTIBILITY1 signaling in Arabidopsis immunity and cell death is regulated by the monooxygenase FMO1 and the nudix hydrolase NUDT7. Plant Cell 18 1038–1051. - PMC - PubMed
    1. Bechtold, U., Karpiński, S., and Mullineaux, P.M. (2005). The influence of the light environment and photosynthesis on oxidative signaling responses in plant-biotrophic pathogen interactions. Plant Cell Environ. 28 1046–1055.

Publication types

MeSH terms