. 2009 Jan;149(1):220-34.
doi: 10.1104/pp.108.126714. Epub 2008 Sep 12.

The ATG autophagic conjugation system in maize: ATG transcripts and abundance of the ATG8-lipid adduct are regulated by development and nutrient availability

Affiliations

The ATG autophagic conjugation system in maize: ATG transcripts and abundance of the ATG8-lipid adduct are regulated by development and nutrient availability

Taijoon Chung et al. Plant Physiol. 2009 Jan.

Abstract

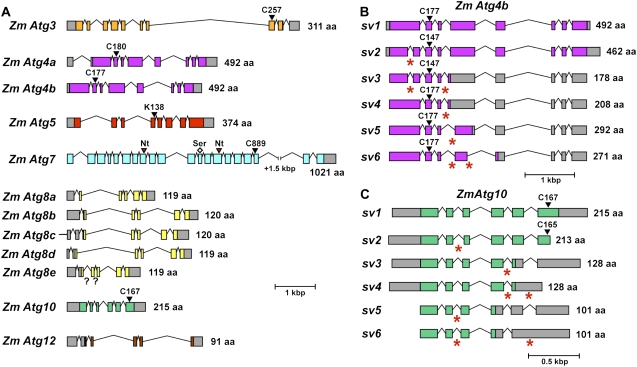
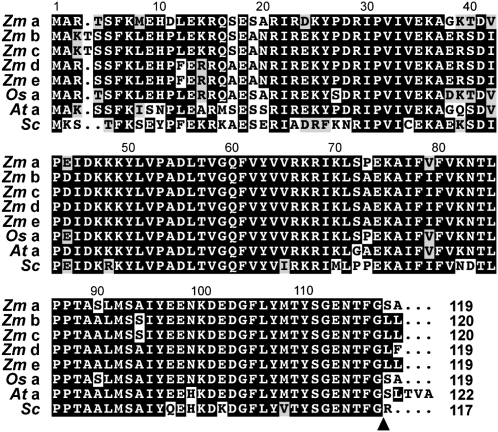
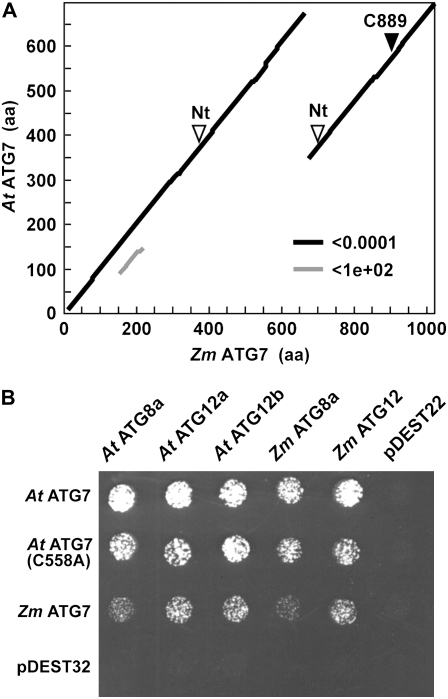
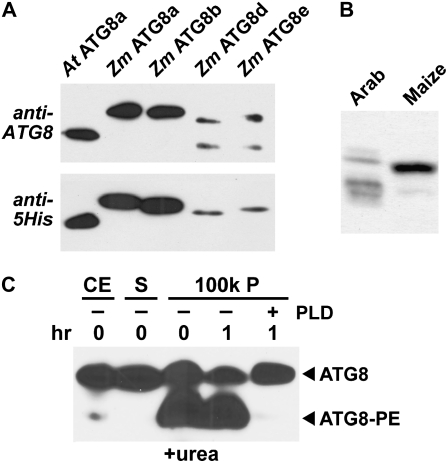
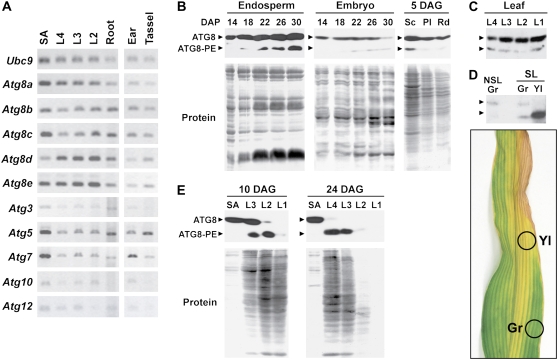
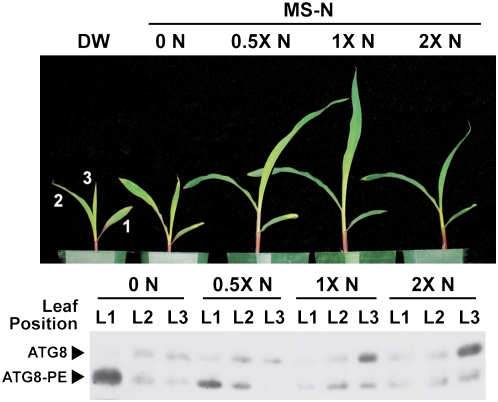
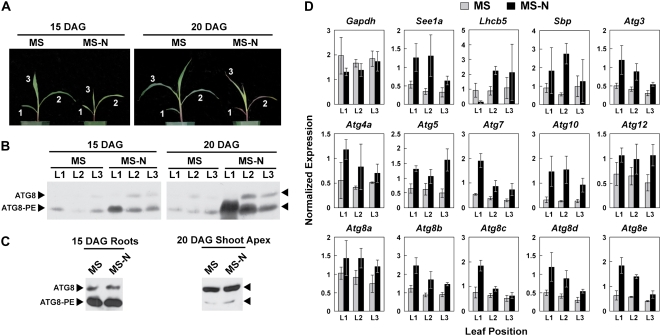
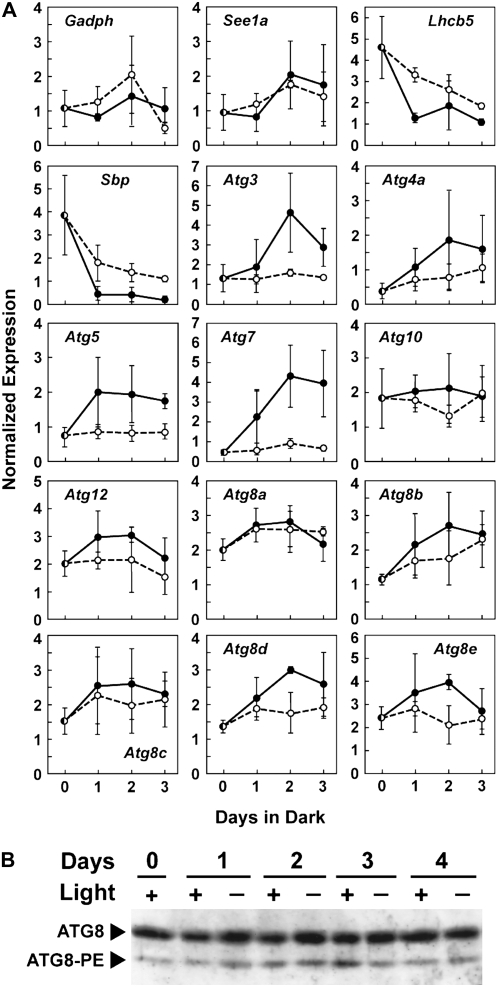
Plants employ sophisticated mechanisms to recycle intracellular constituents needed for growth, development, and survival under nutrient-limiting conditions. Autophagy is one important route in which cytoplasm and organelles are sequestered in bulk into vesicles and subsequently delivered to the vacuole for breakdown by resident hydrolases. The formation and trafficking of autophagic vesicles are directed in part by associated conjugation cascades that couple the AUTOPHAGY-RELATED8 (ATG8) and ATG12 proteins to their respective targets, phosphatidylethanolamine and the ATG5 protein. To help understand the importance of autophagy to nutrient remobilization in cereals, we describe here the ATG8/12 conjugation cascades in maize (Zea mays) and examine their dynamics during development, leaf senescence, and nitrogen and fixed-carbon starvation. From searches of the maize genomic sequence using Arabidopsis (Arabidopsis thaliana) and rice (Oryza sativa) counterparts as queries, we identified orthologous loci encoding all components necessary for ATG8/12 conjugation, including a five-member gene family expressing ATG8. Alternative splicing was evident for almost all Atg transcripts, which could have important regulatory consequences. In addition to free ATG8, its membrane-associated, lipidated form was detected in many maize tissues, suggesting that its conjugation cascade is active throughout the plant at most, if not all, developmental stages. Levels of Atg transcripts and/or the ATG8-phosphatidylethanolamine adduct increase during leaf senescence and nitrogen and fixed-carbon limitations, indicating that autophagy plays a key role in nutrient remobilization. The description of the maize ATG system now provides a battery of molecular and biochemical tools to study autophagy in this crop under field conditions.


Figures

Figure 1.
Figure 1.
Description of the maize Atg genes that participate in the ATG8/12 conjugation cascades. A, Diagram of the maize Atg genes. Colored and gray boxes represent coding and untranslated regions, respectively. Solid lines represent introns, and question marks indicate sequence gaps in introns. The predicted amino acid (aa) length for each of the corresponding proteins is shown at right. The conserved active-site Cys residues (C) for ATG3, ATG4a, ATG4b, ATG7, and ATG10 and the conserved Lys (K) acceptor site in ATG5 for ATG12 attachment are indicated by the black arrowheads. The predicted nucleotide-binding pockets (Nt) in ATG7 are represented by red arrowheads. The diamond indicates the Ser residue within the degenerated active site in the first duplicated C-terminal domain of ATG7 (see Fig. 3). B and C, Splice variants (SVs) of maize Atg4b (B) and Atg10 (C). Red asterisks represent alternative 5′ (for SV6 in Atg4b and SV3 and SV4 in Atg10) or 3′ (for SV3, SV4, SV5, and SV6 in Atg4b and SV2, SV5, and SV6 in Atg10) splice sites or sites of intron retention (for SV2 and SV3 in Atg4b and SV4 and SV6 in Atg10). See Supplemental Table S1 for EST and cDNA sequences supporting each SV.
Figure 2.
Figure 2.
Amino acid sequence comparisons of the five maize (Zm) ATG8 isoforms with rice (Os) ATG8a, Arabidopsis (At) ATG8a, and yeast (Sc) ATG8. Identical and similar amino acids are in white letters and gray boxes, respectively. The processing site by the ATG4 protease that exposes the C-terminal Gly of ATG8 for lipidation is identified by the arrowhead. The number of amino acids for each protein is indicated at the end of the sequence.
Figure 3.
Figure 3.
The maize ATG7 protein contains a C-terminal duplication. A, A PLALIGN dot plot of local sequence similarity for maize (Zm) ATG7 versus Arabidopsis (At) ATG7 reveals the C-terminal duplicated region. The duplicated nucleotide-binding pocket (Nt) and the active-site Cys (C889) are indicated by the arrowheads. aa, Amino acids. B, Zm ATG7 retains its ability to interact with ATG8 and ATG12 by Y2H analysis despite the C-terminal duplication. Binding of full-length Zm and At ATG7 proteins with maize and Arabidopsis versions of ATG8 and ATG12 was demonstrated by growth on selection medium lacking His, Leu, and Trp and containing 3-amino-1′,2′,4′-triazole. At ATG7(C558A) represents an enzymatically inactive mutant in which the active-site Cys (C558) that interacts with ATG8 and ATG12 via a thiolester linkage was substituted for an Ala. pDEST22 and pDEST32 represent empty vector controls for either the activation domain or the binding domain construction.
Figure 4.
Figure 4.
Detection of free ATG8 and the ATG8-PE adduct in maize by immunoblot analysis with anti-At ATG8a antibodies. A, Cross-reactivity of anti-At ATG8a antibodies with Zm ATG8a, ATG8b, ATG8d, and ATG8e. Each lane represents an aliquot of a crude E. coli extract expressing the various 6His-tagged recombinant proteins that was separated by SDS-PAGE without urea. (Zm ATG8c, which is identical in amino acid sequence to Zm ATG8b, was not tested.) The ATG8 proteins were then detected by immunoblot analysis with either anti-At ATG8a antibodies (top) or anti-5His antibodies (bottom). B, Detection of Zm ATG8 in crude extracts with anti-At ATG8 antibodies. Crude extracts prepared from Arabidopsis and maize seedlings were separated by SDS-PAGE without urea. C, Detection of the ATG8-PE adduct in maize. Crude extracts (CE) prepared from maize roots were centrifuged at 100,000g to collect the soluble (S) and membrane (100k P) fractions. The 100k P was solubilized with Triton X-100 and incubated for 1 h with or without PLD. The samples were then subjected to SDS-PAGE in the presence of 6 m urea. The free and lipidated forms of ATG8 are indicated by the arrowheads.
Figure 5.
Figure 5.
Developmental patterns of maize Atg gene expression and ATG8 lipidation. A, Zm Atg transcripts are expressed ubiquitously in various maize tissues. The shoot apex (SA), L4, L3, and L2 seedling leaves (leaf numbers correspond to the order of appearance), and roots were collected from seedlings grown hydroponically for 20 d with MS medium. The nonpollinated ears and tassels were collected from a mature plant grown in soil. Total RNA was subjected to semiquantitative RT-PCR using primers specific for various maize Atg genes or the Ubc9 control gene. B to E, Analysis of free ATG8 and the ATG8-PE adduct. Crude extracts were prepared from various tissues and subjected to SDS-PAGE with 6 m urea followed by immunoblot analysis with anti-At ATG8a antibodies. B, Endosperm and embryos at various DAP from a soil-grown plant and tissues dissected from seedlings germinated for 5 d on MS medium. Sc, Scutellum; Pl, plumule; Rd, radicle. C, Leaves from seedlings grown in soil for 20 DAG. D, Naturally senescing leaves. Samples were collected from a nonsenescing leaf (NSL) and yellow (Yl) and green (Gr) sectors from a subtending senescing leaf (SL; see photograph for the sampled areas) from a flowering plant grown in soil. E, Shoot apex and leaves of various ages (L1 older to L4 younger) from seedlings grown hydroponically on MS medium for the indicated DAG. C and D contain 20 μg of total protein per lane. The lanes in B and E were loaded on an equal fresh weight basis except for Pl, Rd, and SA. Protein profiles in the lower panels of B and E were detected by Ponceau S staining.
Figure 6.
Figure 6.
N-dependent ATG8 lipidation. Maize seedlings were grown hydroponically on vermiculite for 15 DAG, supplied with deionized water (DW), MS-N alone (0 N), or MS-N supplemented with various strengths (0.5×, 1×, or 2× N) of nitrate (see “Materials and Methods” for details). Top, Typical growth of 15-DAG seedlings using the above conditions to show the effects of the N limitations. Bottom, Levels of lipidated and free ATG8 in the leaves of plants shown in the top panel. SDS-PAGE and immunoblot analysis were performed as in Figure 5. Each lane contains 20 μg of total protein.
Figure 7.
Figure 7.
Maize seedlings respond to N limitation by increasing Atg gene expression and ATG8 protein abundance in a leaf age-dependent pattern. Seedlings were grown hydroponically in vermiculite subirrigated with MS medium or MS-N. A, Photographs of 15-DAG (left) and 20-DAG (right) seedlings grown on MS medium (left seedlings) and MS-N (right seedlings). Leaves at the various positions analyzed (L1 older to L3 younger) are indicated. B and C, Accumulation of free ATG8 and the ATG8-PE adduct in leaves (B) and in roots and the shoot apex (C). Crude extracts (20 μg of total protein) were subjected to SDS-PAGE and immunoblot analysis as in Figure 5. D, Levels of various Zm Atg mRNAs increase upon N limitation. Total RNA was isolated from the leaves shown in A and subjected to semiquantitative RT-PCR. Expression levels were normalized by dividing the amounts of PCR products by those produced from the Zm Ubc9 control transcript. Each bar represents the average of three biological replicates ± sd. Note that expression values among genes cannot be compared, due to the different amplification conditions used for each gene.
Figure 8.
Figure 8.
Response of maize seedling leaves to dark-induced fixed-C limitation. A basal part of the second leaf blade (L2) of 15-DAG plants was wrapped with aluminum foil (75 mm in length). The leaf blade was harvested immediately or at 1, 2, or 3 d after wrapping and used for semiquantitative RT-PCR (A) or immunoblot analysis of the ATG8 protein (B) as described for Figure 7. The corresponding regions of light-exposed leaves of the same developmental age were used as controls. Black and white circles in A represent means of three normalized expression values from dark-treated and illuminated leaves, respectively.

References

    1. Altschul SF, Gish W, Miller W, Myers EW, Lipman DJ (1990) Basic local alignment search tool. J Mol Biol 215 403–410 - PubMed
    1. Bassham DC (2007) Plant autophagy: more than a starvation response. Curr Opin Plant Biol 10 587–593 - PubMed
    1. Buchanan-Wollaston V, Page T, Harrison E, Breeze E, Lim PO, Nam HG, Lin JF, Wu SH, Swidzinski J, Ishizaki K, et al (2005) Comparative transcriptome analysis reveals significant differences in gene expression and signalling pathways between developmental and dark/starvation-induced senescence in Arabidopsis. Plant J 42 567–585 - PubMed
    1. Chan AP, Pertea G, Cheung F, Lee D, Zheng L, Whitelaw C, Pontaroli AC, SanMiguel P, Yuan Y, Bennetzen J, et al (2006) The TIGR maize database. Nucleic Acids Res 34 D771–D776 - PMC - PubMed
    1. Contento AL, Kim SJ, Bassham DC (2004) Transcriptome profiling of the response of Arabidopsis suspension culture cells to Suc starvation. Plant Physiol 135 2330–2347 - PMC - PubMed

Publication types

LinkOut - more resources