

Suppression of LPS-induced Interferon-gamma and nitric oxide in splenic lymphocytes by select estrogen-regulated microRNAs: a novel mechanism of immune modulation
- PMID: 18791161
- PMCID: PMC2597130
- DOI: 10.1182/blood-2008-04-152488
Suppression of LPS-induced Interferon-gamma and nitric oxide in splenic lymphocytes by select estrogen-regulated microRNAs: a novel mechanism of immune modulation
Abstract
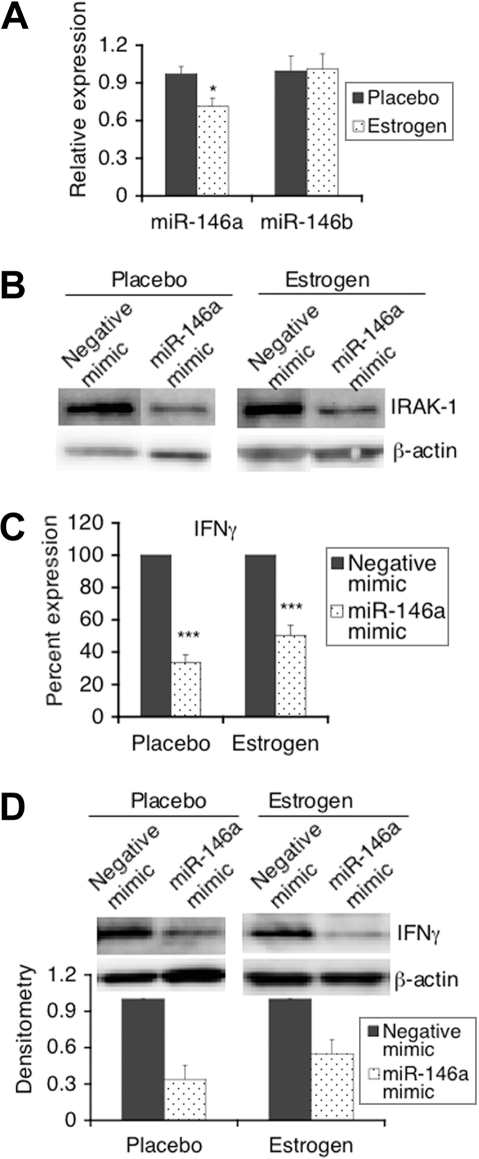
MicroRNAs (miRNAs), recently identified noncoding small RNAs, are emerging as key regulators in homeostasis of the immune system. Therefore, aberrant expression of miRNAs may be linked to immune dysfunction, such as in chronic inflammation and autoimmunity. In this study, we investigated the potential role of miRNAs in estrogen-mediated regulation of innate immune responses, as indicated by up-regulation of lipopolysaccharide (LPS)-induced interferon-gamma (IFNgamma), inducible nitric oxide synthase (iNOS), and nitric oxide in splenic lymphocytes from estrogen-treated mice. We found that miR-146a, a negative regulator of Toll-like receptor (TLR) signaling, was decreased in freshly isolated splenic lymphocytes from estrogen-treated mice compared with placebo controls. Increasing the activity of miR-146a significantly inhibited LPS-induced IFNgamma and iNOS expression in mouse splenic lymphocytes. Further, miRNA microarray and real-time reverse transcriptase-polymerase chain reaction (RT-PCR) analysis revealed that estrogen selectively up-regulates/down-regulates the expression of miRNAs in mouse splenic lymphocytes. miR-223, which is markedly enhanced by estrogen, regulates LPS-induced IFNgamma, but not iNOS or nitric oxide in splenic lymphocytes. Inhibition of miR-223 activity decreased LPS-induced IFNgamma in splenic lymphocytes from estrogen-treated mice. Our data are the first to demonstrate the selective regulation of miRNA expression in immune cells by estrogen and are indicative of an important role of miRNAs in estrogen-mediated immune regulation.
Figures


Similar articles
-
Estrogen up-regulates inducible nitric oxide synthase, nitric oxide, and cyclooxygenase-2 in splenocytes activated with T cell stimulants: role of interferon-gamma.Endocrinology. 2006 Feb;147(2):662-71. doi: 10.1210/en.2005-0829. Epub 2005 Nov 17. Endocrinology. 2006. PMID: 16293660
-
Ubiquitin-like protein MNSFβ covalently binds to Bcl-G and enhances lipopolysaccharide/interferon γ-induced apoptosis in macrophages.FEBS J. 2013 Mar;280(5):1281-93. doi: 10.1111/febs.12120. Epub 2013 Feb 11. FEBS J. 2013. PMID: 23298187
-
Signal transducer and activation of transcription (STAT) 4beta, a shorter isoform of interleukin-12-induced STAT4, is preferentially activated by estrogen.Endocrinology. 2009 Mar;150(3):1310-20. doi: 10.1210/en.2008-0832. Epub 2008 Nov 6. Endocrinology. 2009. PMID: 18988675 Free PMC article.
-
Estrogen regulation of nitric oxide and inducible nitric oxide synthase (iNOS) in immune cells: implications for immunity, autoimmune diseases, and apoptosis.Nitric Oxide. 2006 Nov;15(3):177-86. doi: 10.1016/j.niox.2006.03.009. Epub 2006 May 2. Nitric Oxide. 2006. PMID: 16647869 Review.
-
Regulation of the MIR155 host gene in physiological and pathological processes.Gene. 2013 Dec 10;532(1):1-12. doi: 10.1016/j.gene.2012.12.009. Epub 2012 Dec 14. Gene. 2013. PMID: 23246696 Review.
Cited by
-
Sex Hormones in Acquired Immunity and Autoimmune Disease.Front Immunol. 2018 Oct 4;9:2279. doi: 10.3389/fimmu.2018.02279. eCollection 2018. Front Immunol. 2018. PMID: 30337927 Free PMC article. Review.
-
MALAT-1/p53/miR-155/miR-146a ceRNA circuit tuned by methoxylated quercitin glycoside alters immunogenic and oncogenic profiles of breast cancer.Mol Cell Biochem. 2022 Apr;477(4):1281-1293. doi: 10.1007/s11010-022-04378-4. Epub 2022 Feb 7. Mol Cell Biochem. 2022. PMID: 35129780
-
miRNA as a New Regulatory Mechanism of Estrogen Vascular Action.Int J Mol Sci. 2018 Feb 6;19(2):473. doi: 10.3390/ijms19020473. Int J Mol Sci. 2018. PMID: 29415433 Free PMC article. Review.
-
Estrogen regulates transcription factors STAT-1 and NF-kappaB to promote inducible nitric oxide synthase and inflammatory responses.J Immunol. 2009 Dec 1;183(11):6998-7005. doi: 10.4049/jimmunol.0901737. Epub 2009 Nov 4. J Immunol. 2009. PMID: 19890039 Free PMC article.
-
Sex steroids and autoimmune rheumatic diseases: state of the art.Nat Rev Rheumatol. 2020 Nov;16(11):628-644. doi: 10.1038/s41584-020-0503-4. Epub 2020 Oct 2. Nat Rev Rheumatol. 2020. PMID: 33009519
References
-
- Kawai T, Akira S. TLR signaling. Cell Death Differ. 2006;13:816–825. - PubMed
-
- Takeda K, Akira S. Toll-like receptors in innate immunity. Int Immunol. 2005;17:1–14. - PubMed
-
- Doyle SL, O'Neill LA. Toll-like receptors: from the discovery of NFkappaB to new insights into transcriptional regulations in innate immunity. Biochem Pharmacol. 2006;72:1102–1113. - PubMed
-
- Liew FY, Xu D, Brint EK, O'Neill LA. Negative regulation of toll-like receptor-mediated immune responses. Nat Rev Immunol. 2005;5:446–458. - PubMed
-
- Lang T, Mansell A. The negative regulation of Toll-like receptor and associated pathways. Immunol Cell Biol. 2007;85:425–434. - PubMed
Publication types
MeSH terms
Substances
Grants and funding
LinkOut - more resources
Full Text Sources
Other Literature Sources
Molecular Biology Databases
