The effect of age on short-term outcomes after pancreatic resection: a population-based study
- PMID: 18791366
- PMCID: PMC4006954
- DOI: 10.1097/SLA.0b013e318185e1b3
The effect of age on short-term outcomes after pancreatic resection: a population-based study
Abstract
Objective: To use a large population-based cohort to determine age-dependent short-term outcomes after pancreatic resection.
Methods: We identified all pancreatic resections in Texas from 1999 to 2005. Patients were stratified into 4 age groups (<60, 60-69, 70-79, and 80+ years). Bivariate and multivariate analyses were performed to determine the effect of age on mortality, discharge to home versus requiring inpatient nursing care, and length of stay.
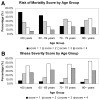
Results: Three thousand seven hundred and thirty-six patients underwent pancreatic resection. Unadjusted in-hospital mortality increased with each increasing age group from 2.4% in patients <60 to 11.4% in patients 80 years and older (P < 0.0001). Likewise, postoperative lengths of stay increased with each increasing age group (P = 0.02). Age group independently predicted the need for discharge to an inpatient nursing unit rather than home (P < 0.0001), with the odds ration (OR) increasing with each increasing age group. With each increasing age group, patients were less likely to be resected at high-volume (H-V) hospitals (>10 pancreatic resections/y). Whereas low-volume (L-V) hospitals (< or =10 pancreatic resections/y) had higher mortality rates (3.2% versus 7.3%, P < 0.0001), the difference in mortality between H- and L-V hospitals was more striking in older patients. With increasing age group, mortality increased from 3.0% to 9.5% to 11.4% to 14.7% at L-V hospitals. It increased from 2.0% to 3.5% to 4.5% to 8.7% at H-V hospitals (P < 0.0001). In the multivariate model controlling for gender, race, hospital volume, year of surgery, diagnosis, risk of mortality, severity of illness, admission status, and procedure type, older age group independently predicted increased mortality. The OR for patients 60-69 years was 2.5 (P = 0.0003), the OR for patients 70-79 years was 1.8 (P = 0.02), and the OR for patients 80+ years was 4.4 (P < 0.0001) when compared with patients <60 years.
Conclusions: In contrast to some previous single-institution studies, we found that increased age is an independent risk factor for mortality after pancreatic resection. For all ages, mortality rates were higher at L-V hospitals, but the difference worsened significantly with increasing age. Older patients had longer lengths of stay, were less likely to be discharged home, and more likely to require care at an inpatient nursing or acute care facility at the time of discharge.
Figures

References
-
- United States Census Bureau. [Accessed 3/14/08];Sixty-five plus in the United States. 2001 http://www.census.gov/population/socdemo/statbriefs/agebrief.html.
-
- U.S. Department of Commerce, U.N. Department of Public Information. An aging world 2001, DP/2264. Mar, 2002.
-
- Anderson RN, DeTurk PB. United States Life Tables, 1999. National Vital Statistics Report. 2002;50:33. - PubMed
-
- Lillemoe KD. Pancreatic disease in the elderly patient. Surg Clin North Am. 1994;74:317–344. - PubMed
Publication types
MeSH terms
Grants and funding
LinkOut - more resources
Full Text Sources
Medical

