. 2008 Sep 15;3(9):e3211.
doi: 10.1371/journal.pone.0003211.

In vitro cellular adaptations of indicators of longevity in response to treatment with serum collected from humans on calorie restricted diets

Affiliations

In vitro cellular adaptations of indicators of longevity in response to treatment with serum collected from humans on calorie restricted diets

Joanne S Allard et al. PLoS One. .

Abstract

Calorie restriction (CR) produces several health benefits and increases lifespan in many species. Studies suggest that alternate-day fasting (ADF) and exercise can also provide these benefits. Whether CR results in lifespan extension in humans is not known and a direct investigation is not feasible. However, phenotypes observed in CR animals when compared to ad libitum fed (AL) animals, including increased stress resistance and changes in protein expression, can be simulated in cells cultured with media supplemented with blood serum from CR and AL animals. Two pilot studies were undertaken to examine the effects of ADF and CR on indicators of health and longevity in humans. In this study, we used sera collected from those studies to culture human hepatoma cells and assessed the effects on growth, stress resistance and gene expression. Cells cultured in serum collected at the end of the dieting period were compared to cells cultured in serum collected at baseline (before the dieting period). Cells cultured in serum from ADF participants, showed a 20% increase in Sirt1 protein which correlated with reduced triglyceride levels. ADF serum also induced a 9% decrease in proliferation and a 25% increase in heat resistance. Cells cultured in serum from CR participants induced an increase in Sirt1 protein levels by 17% and a 30% increase in PGC-1alpha mRNA levels. This first in vitro study utilizing human serum to examine effects on markers of health and longevity in cultured cells resulted in increased stress resistance and an up-regulation of genes proposed to be indicators of increased longevity. The use of this in vitro technique may be helpful for predicting the potential of CR, ADF and other dietary manipulations to affect markers of longevity in humans.


Conflict of interest statement

Competing Interests: The authors have declared that no competing interests exist.

Figures

Figure 1
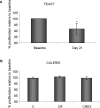
Figure 1. Proliferation of HepG2 cells cultured with serum from FEAST and CALERIE participants.
HepG2 cells were cultured in 96 well culture plates in culture media supplemented with 10% human serum. After 48 hours in culture, differences in the proliferation of HepG2 cells in serum collected at day 21 from FEAST participants or after 3 months from CALERIE participants were compared to the proliferation of cells cultured in serum from the same participants collected on baseline day. Graph shows % proliferation relative to baseline of cells cultured in serum collected from participants of the (A) FEAST study (n = 11) and (B) CALERIE (n = 9 for C group, n = 11 for CR group, n = 11 for CREX group) study. * = statistically significant p = 0.032).
Figure 2
Figure 2. Resistance to heat shock of HepG2 cells cultured with serum collected at baseline and serum collected at the end of the diet regimen from FEAST and CALERIE participants.
HepG2 cells were cultured for 24 hrs in 96-well culture plates in culture media supplemented with 10% human serum. Plates were then either subjected to a 1 hr incubation period at 45°C or left under normal culture control conditions. 24 hrs after heat shock treatment, surviving cells were determined using a CCK-8 soln. Graph shows an increased resistance to heat shock in cells cultured with FEAST serum, * = p<0.0005 (A) and no changes in cells cultured in serum form all groups of the CALERIE study (B).
Figure 3
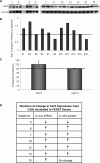
Figure 3. Increased Sirt1 protein levels in cells incubated in FEAST sera.
Sirt1 expression was evaluated using western blotting techniques. (A) The first and second band of each pair of bands under the subject # represents relative levels of Sirt1 protein induced by baseline and day 21 sera samples respectively. (B) shows relative values of levels induced in cells cultured in day 21 sera with respect to cells cultured in baseline sera. (C) Cumulative average change in Sirt1 and HSP70 levels induced by day 21 sera with respect to baseline sera. *p<.0005 (D) shows the directional change in Sirt1 mRNA levels in muscle biopsies from baseline to 3 weeks matched exactly in 6 out of 7 participants whose serum was used for Sirt1 protein in vitro analysis.
Figure 4
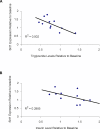
Figure 4. Correlations of changes in Sirt1 protein expression with changes in serum insulin and triglyceride levels with respect to baseline levels.
Changes in Sirt1 protein expression from cells cultured with baseline and end of diet serum from individuals of the FEAST study were correlated to changes in each individual's serum levels of triglycerides (A) and insulin (B) relative to baseline levels.
Figure 5
Figure 5. Increased Sirt1 protein levels in cells incubated in CR sera.
Sirt1 expression was evaluated using western blotting techniques. (A) Shows representative blots of Sirt1 and β-actin protein. The first and second bands of each pair of bands represent relative levels of Sirt1 protein induced in HepG2 cells by baseline (BL) and 3 month (3 M) sera samples, respectively. (B) Shows changes in sirt1 levels relative to baseline. For C, CR and CREX n = 9, 11 and 11 respectively. * p = 0.018.
Figure 6
Figure 6. Changes in PGC-1α mRNA expression in cells cultured with sera from CALERIE Participants.
HepG2 cells were cultured in media supplemented with human sera for 48 h (A) shows relative changes in PGC-1α mRNA in cells cultured with serum collected after 3 months on diets compared to cells cultured with serum collected at baseline. (B) Shows the average relative change in PGC-1α mRNA expression for each diet group. For C, CR and CREX n = 7, 8 and 9, respectively. * p = 0.032.

Similar articles

Cited by

References

    1. Austad SN. Life extension by dietary restriction in the bowl and doily spider, Frontinella pyramitela. Exp Gerontol. 1989;24:83–92. - PubMed
    1. Heilbronn LK, de Jonge L, Frisard MI, DeLany JP, Larson-Meyer DE, et al. Effect of 6-month calorie restriction on biomarkers of longevity, metabolic adaptation, and oxidative stress in overweight individuals: a randomized controlled trial. Jama. 2006;295:1539–1548. - PMC - PubMed
    1. Lin SJ, Defossez PA, Guarente L. Requirement of NAD and SIR2 for life-span extension by calorie restriction in Saccharomyces cerevisiae. Science. 2000;289:2126–2128. - PubMed
    1. Rogina B, Helfand SL. Sir2 mediates longevity in the fly through a pathway related to calorie restriction. Proc Natl Acad Sci U S A. 2004;101:15998–16003. - PMC - PubMed
    1. Masoro EJ. Dietary restriction: current status. Aging (Milano) 2001;13:261–262. - PubMed

Publication types

MeSH terms