. 2008 Sep;38(9):2438-50.
doi: 10.1002/eji.200838289.

Glucose deprivation inhibits multiple key gene expression events and effector functions in CD8+ T cells

Affiliations

Glucose deprivation inhibits multiple key gene expression events and effector functions in CD8+ T cells

Candace M Cham et al. Eur J Immunol. 2008 Sep.

Abstract

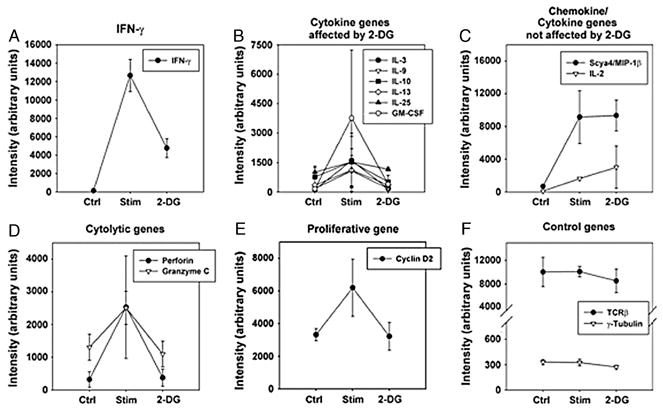
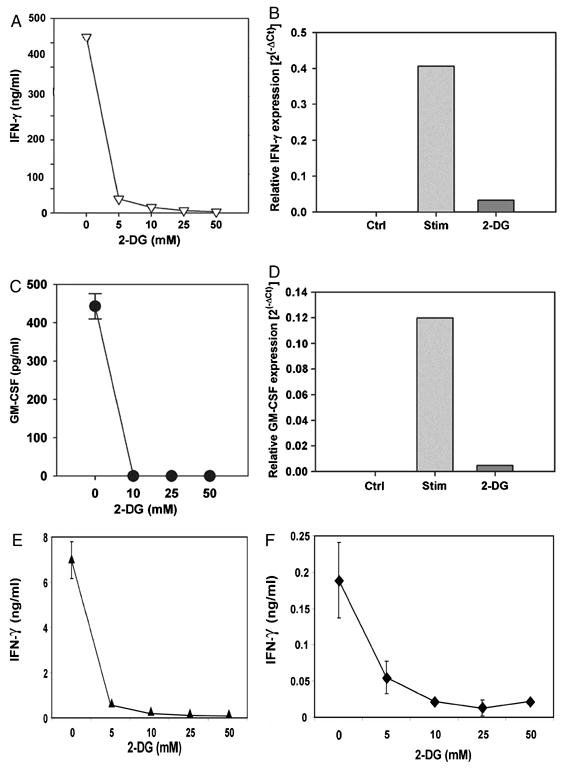
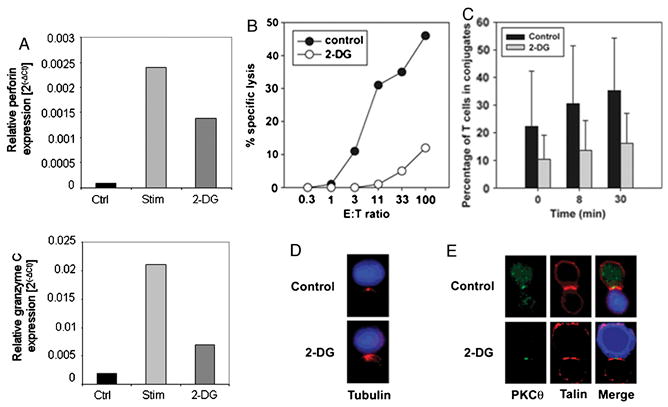
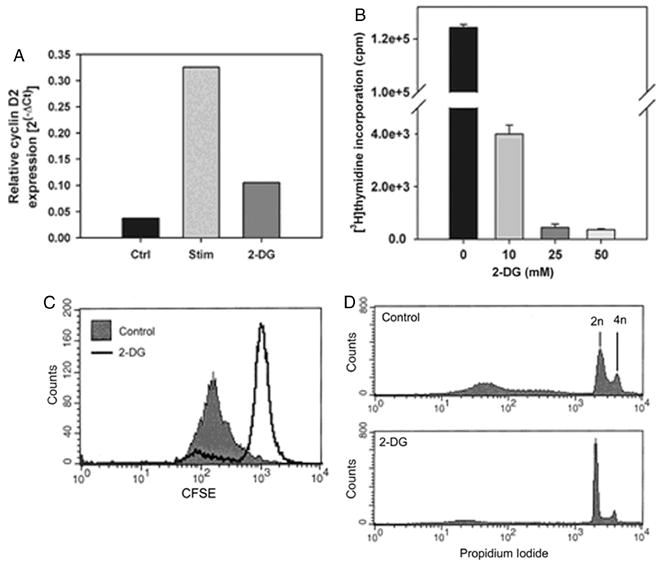
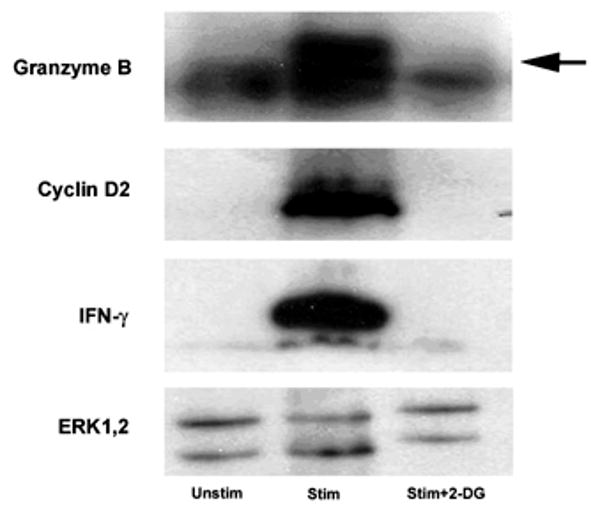
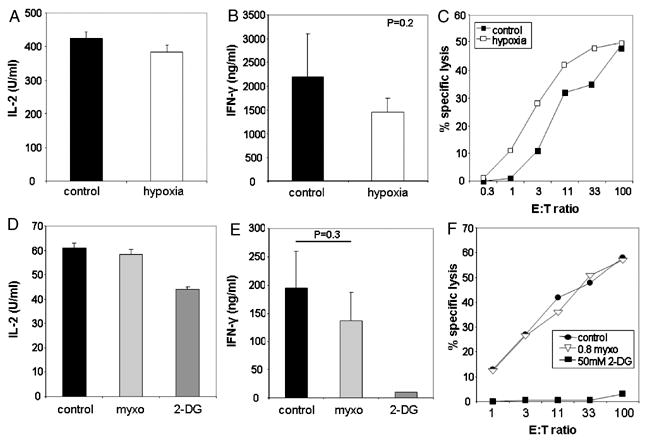
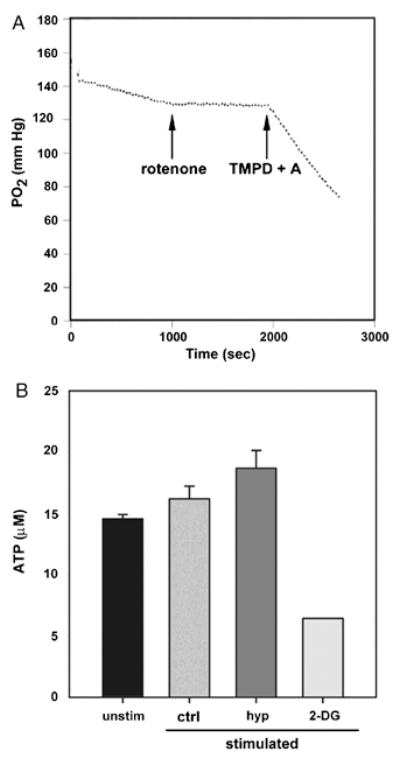
We recently reported that differentiation of CD8(+) T cells from the naïve to the effector state involves the upregulation of glucose-dependent metabolism. Glucose deprivation or inhibition of glycolysis by 2-deoxy-D-glucose (2-DG) selectively inhibited production of IFN-gamma but not of IL-2. To determine a more global role of glucose metabolism on effector T-cell function, we performed gene array analysis on CD8(+) effector T cells stimulated in the presence or absence of 2-DG. We observed that expression of only 10% of genes induced by TCR/CD28 signaling was inhibited by 2-DG. Among these were genes for key cytokines, cell cycle molecules, and cytotoxic granule proteins. Consistent with these results, production of IFN-gamma and GM-CSF, cell cycle progression, upregulation of cyclin D2 protein, cytolytic activity, and upregulation of granzyme B protein and also conjugate formation were exquisitely glucose-dependent. In contrast to glucose, oxygen was little utilized by CD8(+) effector T cells, and relative oxygen deprivation did not inhibit these CTL functional properties. Our results indicate a particularly critical role for glucose in regulating specific effector functions of CD8(+) T cells and have implications for the maintenance of the effector phase of cellular immune responses in target tissue microenvironments such as a solid tumor.


Conflict of interest statement

Conflict of interest: The authors declare no financial or commercial conflict of interest.

Figures

Figure 1
Figure 1. Gene expression analyzed using Affymetrix chips representing 35,000 oligonucleotides
2-DG affects only a subset of genes in stimulated CD8+ effector T cells. CD8+ effector T cells were stimulated for 12 hours with anti-CD3 and anti-CD28 mAb-coated beads in the presence or absence of 50 mM 2-DG. Control (Ctrl), unstimulated; stimulated (Stim); stimulated in the presence of 50 mM 2-DG (2-DG). Genes affected by 2-DG treatment include IFN-γ (A), several cytokines including GM-CSF, IL-3, IL-9, IL-10 (B) but not MIP-1β and IL-2 (C). Cytolytic and proliferative genes like perforin, granzyme B (D) and cyclin D2 (E) were also highly affected by 2-DG treatment as compared to unmodulated control genes like γ-tubulin and TCR-β (F). Individual hybridizations were normalized using dChip software, then averaged. Data represent the average + SD of two independent experiments.
Figure 2
Figure 2. Effector cytokine production, proliferation, and cytolytic activity are glucose-dependent
A. IFN-γ production by CD8+ effector T cells following anti-CD3 and anti-CD28 stimulation were measured by ELISA. Supernatant was collected after 24 hours of stimulation. Data represent the average + SD of three independent experiments and the 2-DG effect was statistically significant (p<0.01). B. Quantitative RT-PCR of IFN-γ mRNA in cells that were treated with 50 mM 2-DG for 12 hours. C. GM-CSF production by CD8+ effector T cells following stimulation with anti-CD3 and anti-CD28 mAb-coated beads was measured by ELISA. Supernatant was collected after 24 hours of stimulation. Data represent the average + SD of three independent experiments and the inhibition by 2-DG was statistically significant at all concentrations (p<0.001). D. Quantitative RT-PCR of GM-CSF mRNA in cells that were treated with 50 mM 2-DG for 12 hours. Data are representative of at least two independent experiments. E. IFN-γ production by CD8+ T cells primed in vivo with OVA peptide was measured by ELISA. Supernatant was collected after 20 hours of in vitro re-stimulation with OVA peptide. The 2-DG effect on IFN-γ was statistically significant (p<0.001) for all the concentrations tested. F. IFN-γ production by CD8+ T cells primed in vivo with OVA peptide was measured by ELISA. Supernatant was collected after 20 hours of stimulation with anti-CD3 and anti-CD28 mAb-coated beads. The 2-DG effect on IFN-γ was statistically significant (p<0.001) for all the concentrations tested. Data for E and F represent the average + SD of two independent experiments.
Figure 3
Figure 3. 2-DG blocks cytolytic activity in CD8+ effector T cells
A. Effect of 50mM 2-DG on induction of perforin and granzyme C mRNA levels, as assessed by quantitative RT-PCR. Data represent average of two independent assays. B. Cytolytic activity of CD8+ effector T cells was determined in a 4-hour 51Cr-release assay, in the presence or absence of 50 mM 2-DG. Data represent the average of five independent experiments. Inhibition by 2-DG was statistically significant at each E:T ratio (P<0.01). C. Conjugate formation was assessed between 2C and P815-B7.1 targets, in the presence or absence of 50mM 2-DG. Calcein AM-labeled T cells (green) were combined with PKH-labeled P815-B7.1 cells (red) for indicated periods of time. Flow cytometry was used to determine the percentage of conjugates out of the total number of cells. Data represent the average + SD of three pooled experiments. D. MTOC reorientation in T cell/target cell conjugates in the presence or absence of 50mM 2-DG, as measured by tubulin staining (red). Data shown is a representative image of at least 20 conjugates analyzed. E. Formation of the cSMAC in T cell/target cell conjugates. Antibodies against PKCθ (green) and talin (red) were used. Target cells were stained with CMAC (blue). Images are representative of at least 20 conjugates analyzed.
Figure 4
Figure 4. 2-DG inhibits cell cycle progression of stimulated CD8+ effector T cells
A. Quantitative RT-PCR of cyclin D2 mRNA levels in cells treated anti-CD3 and anti-CD28 mAb-coated beads in the presence or absence of 2-DG. Data represent the average of two independent experiments. B. [3H]thymidine incorporation was assessed in cells stimulated with anti-CD3/anti-CD28 mAb-coated beads, in the presence or absence of 2-DG. Data represent the average + SD of three independent experiments and the inhibition by 2-DG was statistically significant (p<0.001). C. CFSE-labeled 2C CD8+ effector T cells were stimulated with P815-B7.1 cells in the presence or absence of 10 mM 2-DG. After 48 hours, dilution of CFSE was analyzed by flow cytometry. D. DNA content was assessed of effector T cells stimulated for 48 hours with or without 10 mM 2-DG.
Figure 5
Figure 5. Western blot analysis of selected proteins
2C/RAG2-/- effector CD8+ T cells were stimulated with anti-CD3/anti-CD28 mAb-coated beads for 16 hours, in the presence or absence of 2-DG. Cells were collected, lysed, separated by SDS-PAGE, and blotted for the indicated proteins. The arrow indicates the Granzyme B band above a background band. Similar results were seen in 2 independent experiments.
Figure 6
Figure 6. Select effector functions are minimally affected by oxygen deprivation
A. and B. Production of IL-2 (A) or IFN-γ (B) under hypoxia as assessed by ELISA. Supernatant was collected after 24 hours of stimulation with anti-CD3 and anti-CD28 mAb-coated beads. Data represent the average + SD of at least three independent experiments. C. Cytolytic activity of CD8+ effector T cells was measured in hypoxic or normoxic conditions. P815 cells were used as specific targets. Control, 21% O2; hypoxia, 1% O2. Data represent the average of two independent experiments. D. and E. Production of IL-2 (D) and IFN-γ (E) stimulated with anti-CD3 and anti-CD28 mAb-coated beads in the presence of 0.8 μM myxothiazol (myxo), a cytochrome b-c1 inhibitor, or 50 mM 2-DG, as assessed by ELISA. Supernatant was collected after 24 hours of stimulation. Data represent the average + SD of at least five independent experiments. F. Cytolytic activity of CD8+ effector T cells was performed in the presence or absence of 2-DG or myxothiazol. Data are represent the average of two independent experiments. As in the other studies, inhibition of IFN-γ production and cytolysis by 2-DG was statistically significant (p<0.05), whereas differences seen with myxothiazol or hypoxia were not.
Figure 7
Figure 7. Oxygen is not a main energy source for CD8+ effector T cells
A. The rate of O2 consumption of 3 × 10⁷ unstimulated CD8+ effector T cells. A reduced rate of consumption by the addition of rotenone (5 μM) shows that O2 consumption is mediated via mitochondria. The addition of N, N, N′, N′-tetramethyl-p-phenylenediamine (TMPD; 200 μM) and ascorbate (A; 400 μM) reflects the maximum potential for O2 consumption by these cells. Data are representative of two independent experiments. B. Steady-state levels of ATP in CD8+ effector T cells stimulated with anti-CD3 and anti-CD28 coated beads for 3 hours under the indicated conditions. Control (ctrl), 21% O2, 5% CO2; hypoxia (hyp), 1% O2, 5% CO2; 2-DG (2-DG), 50 mM 2-DG, 21% O2, 5% CO2. Inhibition by 2-DG was statistically significant (p<0.001). Data represent the average + SD of three independent experiments.

References

    1. Cham CM, Gajewski TF. Glucose availability regulates IFN-gamma production and p70S6 kinase activation in CD8+ effector T cells. J Immunol. 2005;174:4670–4677. - PubMed
    1. MacDonald HR. Energy metabolism and T-cell-mediated cytolysis. II. Selective inhibition of cytolysis by 2-deoxy-D-glucose. J Exp Med. 1977;146:710–719. - PMC - PubMed
    1. Fox CJ, Hammerman PS, Thompson CB. Fuel feeds function: energy metabolism and the T-cell response. Nat Rev Immunol. 2005;5:844–852. - PubMed
    1. Stinchcombe JC, Bossi G, Booth S, Griffiths GM. The immunological synapse of CTL contains a secretory domain and membrane bridges. Immunity. 2001;15:751–761. - PubMed
    1. Monks CR, Freiberg BA, Kupfer H, Sciaky N, Kupfer A. Three-dimensional segregation of supramolecular activation clusters in T cells. Nature. 1998;395:82–86. - PubMed

Publication types

LinkOut - more resources