Review
. 2008 Nov;21(9):978-96.
doi: 10.1002/nbm.1311.

Layer-specific anatomical, physiological and functional MRI of the retina

Affiliations
Review

Layer-specific anatomical, physiological and functional MRI of the retina

Timothy Q Duong et al. NMR Biomed. 2008 Nov.

Abstract

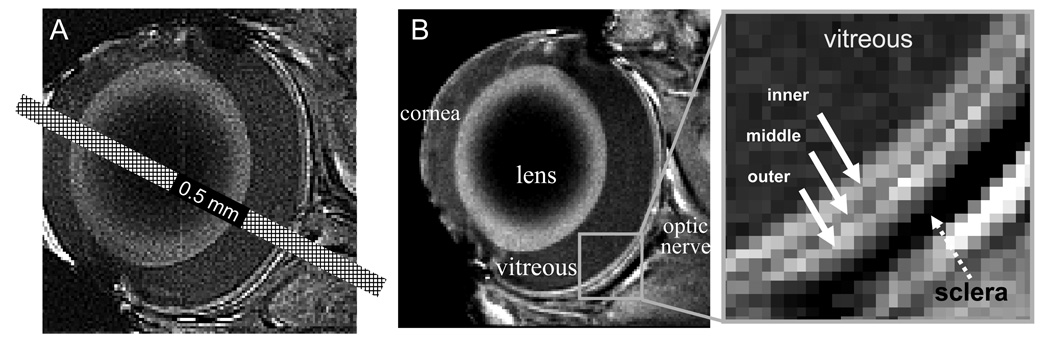
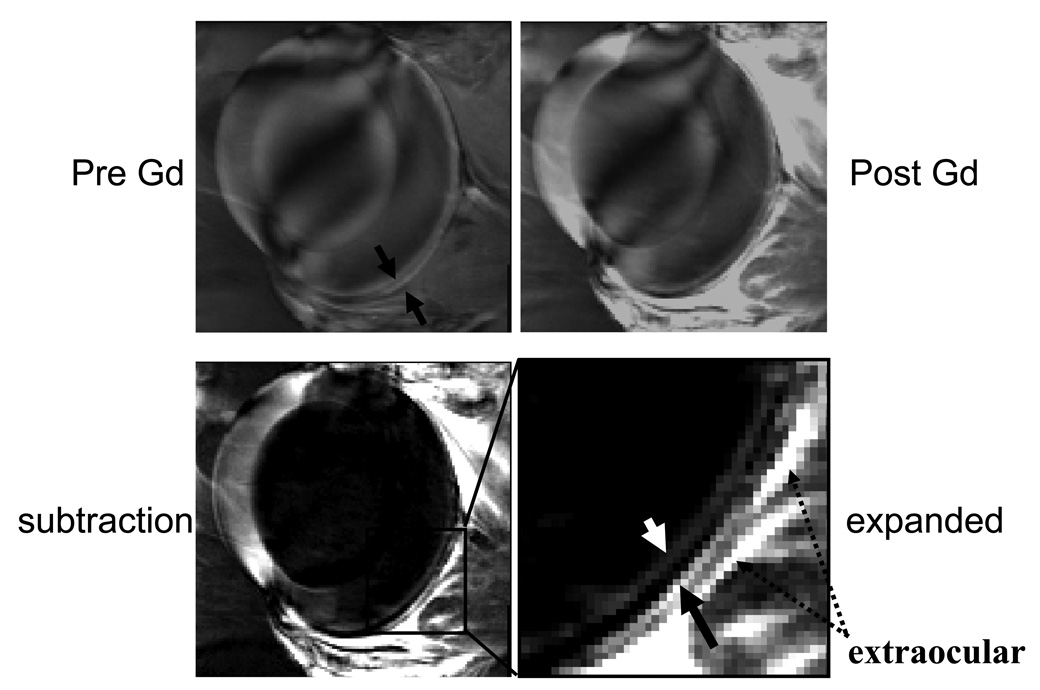
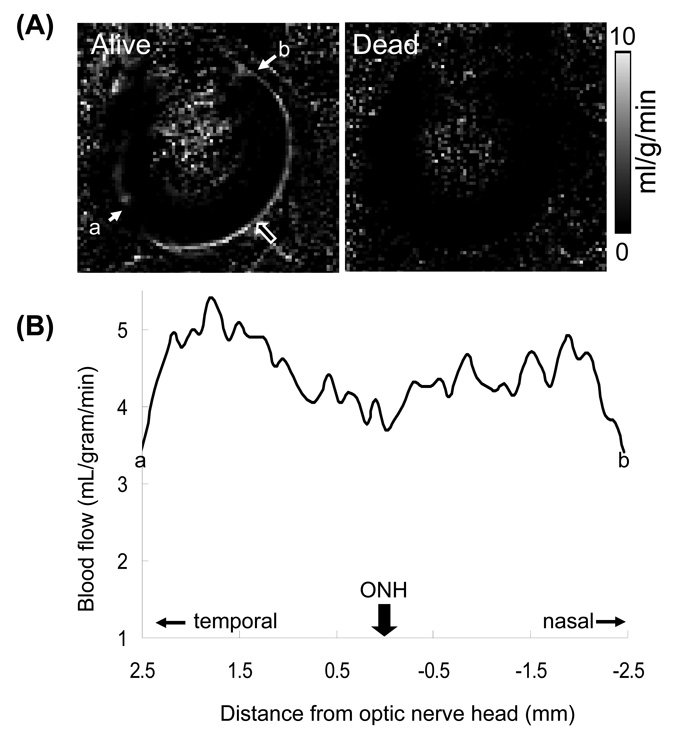
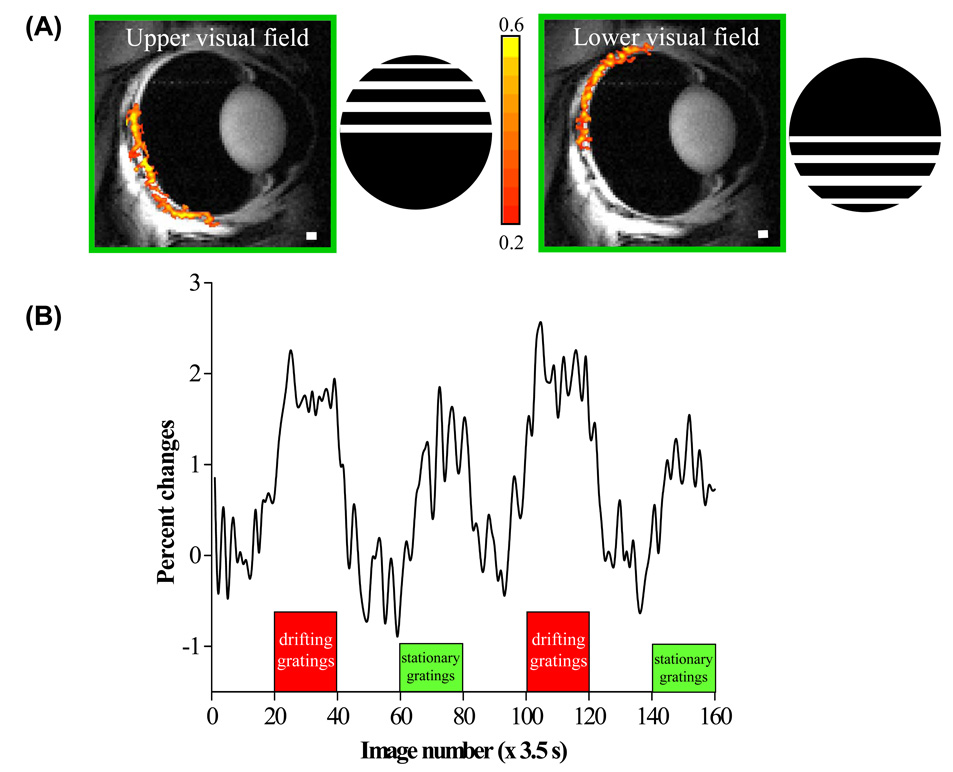
Most retinal imaging has been performed using optical techniques. This paper reviews alternative retinal imaging methods based on MRI performed with spatial resolution sufficient to resolve multiple well-defined retinal layers. The development of these MRI technologies to study retinal anatomy, physiology (blood flow, blood volume, and oxygenation) and function, and their applications to the study of normal retinas, retinal degeneration and diabetic retinopathy in animal models are discussed. Although the spatiotemporal resolution of MRI is poorer than that of optical imaging techniques, it is unhampered by media opacity and can thus image all retinal and pararetinal structures, and has the potential to provide multiple unique clinically relevant data in a single setting and could thus complement existing retinal imaging techniques. In turn, the highly structured retina with well-defined layers is an excellent model for advancing emerging high-resolution anatomical, physiological and functional MRI technologies.


Figures

Figure 1
Figure 1. Cartoon of the eye and histology of a rodent retina
The retina consists of multiple well-defined layers (–3). Starting from the vitreous boundary, they include the ganglion cell layer (GCL), inner plexiform layer (IPL), inner nuclear layer (INL), outer plexiform layer (OPL), outer nuclear layer (ONL), and photoreceptor inner and outer segments (IS+OS). The retina is nourished by two separate blood supplies, namely, the retinal and choroidal circulations. The retinal vessels exist within the GCL, INL, IPL and OPL. The choroidal vessels are located posterior to the photoreceptor layer. The outer nuclear layer and the inner and outer segments, are avascular.
Figure 2
Figure 2. Anatomical and Gd-DTPA-enhanced MRI of the cat retina
(A) Cross-sectional T2-weighted (TE = 40 ms) images at 100×100×1500 µm resolution. Image slice was obtained at the middle of the eye, roughly bisecting the area centralis. The small and large white arrows indicate the “inner” and “outer” strips, respectively. (B) Contrast-enhanced T1-weighted images. The smaller and larger white arrows indicate the “inner” and “outer” bands, respectively. Extra-ocular enhancement was also observed (dashed arrow). Images were obtained with a custom-made radiofrequency coil placed laterally on the side of the eye. Reproduced with permission (30).
Figure 3
Figure 3. Diffusion-weighted MRI of the cat retina
T2-weighted (TE = 40 ms) and diffusion-weighted (b = 504 s/mm2) images at 50×100×1500 µm. Diffusion-sensitizing gradients were placed along the x, y or z axis separately. The small and large white arrows indicate the “inner” and “outer” strips, respectively. Reproduced with permission (30).
Figure 4
Figure 4. Anatomical MRI of the rat retina
(A) A bar depicting a 0.5-mm thick MRI slice, overlaid on an edge-enhanced image, illustrating the negligible partial-volume effect due to the retinal curvature. (B) Anatomical images from a normal Sprague-Dawley adult rat retina at 60×60×500 µm. Three distinct “layers” (solid arrows) of alternating bright, dark and bright bands are evident. Sclera (dashed arrow) is hypointense. Reproduced with permission (9).
Figure 5
Figure 5. Gd-DTPA-enhanced MRI of the rat retina
Contrast-enhanced images at 60×60×500 µm (A) before, (B) after Gd-DTPA administration and (C) the subtracted image. The two arrows in the expanded views indicate the inner and outer bands of the retina corresponding to the two vascular layers, bounding the retina. Two dashed arrows indicate signal enhancement of extra-ocular tissues supplied by Gd-DTPA permeable vessels. Reproduced with permission (9).
Figure 6
Figure 6. Histology of the rat and cat retinas
Histological section of a normal adult Sprague-Dawley rat and cat retina stained with toluidine blue. Three vertical bars on the left show the assignments of the three MRI-derived layers. GCL: ganglion cell layer, IPL: inner plexiform layer, INL: inner nuclear layer, OPL: outer plexiform layer, ONL: outer nuclear layer, IS+OS: inner + outer photoreceptor segment, CH: choroidal vascular layer. In cat, there is an additional layer known as the tapetum which is vascularized. The rat and cat histological slides are drawn approximately to scale. Adapted and reproduced with permission (9) and (30).
Figure 7
Figure 7. Automated analysis of layer-specific retinal thickness
(A) The retina was segmented using edge-detection technique (green trace). Retinal thickness was quantified from point a to b, cognizant of some irregular retinal thickness from posterior pole to the pars plana. (B) Intensity profiles of two animals delineate the outer, middle and inner bands. The dashed arrows indicate the vitreous boundary. Values in µm indicate the band thicknesses. Reproduced with permission (9).
Figure 8
Figure 8. BOLD fMRI response of the retina
Lamina-specific BOLD fMRI responses to (A) hyperoxia (100% O2) and (B) hypercapnia (5% CO2 in air) from a normal rat at 90×90×1000 µm in-plane resolution. BOLD percent-change maps are overlaid on echo-planar images. The color bar indicates BOLD percent changes. (C) Group-averaged hyperoxia- and hypercapnia-induced BOLD percent change in the inner and outer strip (mean ± SD, n = 8). Note that these percent changes due to either hyperoxic or hypercapnic stimulation are larger than those typically reported in the brain, likely because of a greater vascular density in the retina. Reproduced with permission (9).
Figure 9
Figure 9. Basal blood-flow image of the retina
(A) Quantitative basal blood-flow images were obtained from alive and dead animal (same animal). Blood-flow values in the retina and the ciliary body are high, whereas blood flow in the lens and vitreous are within noise levels. Large arrows indicate the locations of the optic nerve head (ONH). (B) Blood-flow values as a function of distance from the ONH. Data were obtained from one distal edge to another (point a to b). Reproduced with permission (34).
Figure 10
Figure 10. Physiologically induced blood-flow changes in the retina
(A) Blood flow percent-change maps responding to physiologic stimuli (100% O2 or 5% CO2) obtained from a representative animal. Percent-changes are overlaid on blood flow maps. Color bars indicate blood-flow percent changes. ONH: optic nerve head. (B) Group-averaged blood-flow profiles across the retinal thickness (mean ± SD, n = 5) under basal conditions, 5% CO2 or 100% O2. Blood-flow changes due to hyperoxia and hypercapnia were statistically significantly different from baseline (air) (P < 0.05). Reproduced with permission (34).
Figure 11
Figure 11. fMRI of visual stimulation of the cat retina
(A) fMRI maps (468×468×1000 µm) of the upper and lower visual field using drifting gratings versus dark. The gratings were square wave with 0.15 cyc/deg and 2 cyc/sec. The color bar indicates cross-correlation coefficient. (B) fMRI signal modulation under dark, drifting gratings and stationary gratings (same luminance). Positive signal changes are observed under both drifting-grating and stationary-grating stimuli relative to the dark basal conditions. Signal change due to the drifting gratings is approximately twice that of stationary gratings. Adapted from (91).
Figure 12
Figure 12. Manganese-enhanced MRI
T1-weighted images at 25×25×800 µm of an rat intravitreally injected with MnCl2 ~24 hrs earlier (A) before, (B) after Gd-DTPA intravenous administration and (C) the “difference” image. Manganese-enhanced MRI reveals seven distinct layers of alternative bright and dark contrasts. Gd-DTPA further enhanced the outer bands on either side of the retina (as indicated by arrows). (D) Signal intensity profiles obtained across the thickness of the retina before and after the intravenous administration of Gd-DTPA. (E) Histological section of a normal adult Sprague-Dawley rat stained with toluidine blue. The tentative MRI layer assignments are: the ganglion cell layer (GCL), inner plexiform layer (IPL), inner nuclear layer (INL), outer plexiform layer (OPL), outer nuclear layer (ONL), photoreceptor inner and outer segments (IS+OS), and choroid (CH). This figure appeared previously in abstract form (33).
Figure 13
Figure 13. Anatomical MRI of retinal degeneration in the RCS rat retinas
Anatomical images at 60×60×500 µm of (A) P16 RCS retina before photoreceptor degeneration (control), and degenerated P120 RCS retina (B) before and (C) after intravenous administration of Gd-DTPA. Arrowheads in C indicate signal enhancement of extra-ocular tissues. Intensity profiles (D) and histological sections (E) show thinning of the P120 compared to the P16 RCS retina. The dashed arrows in D indicate the vitreous boundaries. Reproduced with permission (9).
Figure 14
Figure 14. Anatomical and functional MRI of diabetic retinopathy
The numbers of activated pixels in all layers were diminished in diabetic animals three months after streptozotocin injection. The group-average histogram plots of number of pixels versus BOLD percent changes. For O2 challenge, the area under the curve for diabetes was 42% smaller than controls (P < 0.01). For CO2 challenge, the area under the curve for diabetes was 33% smaller than controls (P < 0.01). This figure appeared previously in abstract form (130).

References

    1. Kaufman PL, Alm A, editors. Adler's Physiology of the Eye. Mosby: St Louis; 1992.
    1. Bron AJ, Tripathi RC, Tripathi BJ. Wolff's Anatomy of the Eye and Orbit. London: Chapman & Hall Medical; 1997.
    1. Buttery RG, Hinrichsen CFL, Weller WL, J.R H. How thick should a retina be? A comparative study of mammalian species with and without intraretinal vasculature. Vision Research. 1991;31:169–187. - PubMed
    1. Harris A, Kagemann L, Cioffi GA. Assessment of human ocular hemodynamics. Surv of Ophthalmol. 1998;42:509–533. - PubMed
    1. Bill A. Circulation in the eye. In: Renkin EM, Michel CC, editors. Handbook of physiology Part 2 in Microcirculation. Bethesda, MD: American Physiological Society; 1984. pp. 1001–1035.

Publication types