. 2008 Aug;15(4):679-91.
doi: 10.3758/pbr.15.4.679.

The comparative study of metacognition: sharper paradigms, safer inferences

Affiliations

The comparative study of metacognition: sharper paradigms, safer inferences

J David Smith et al. Psychon Bull Rev. 2008 Aug.

Abstract

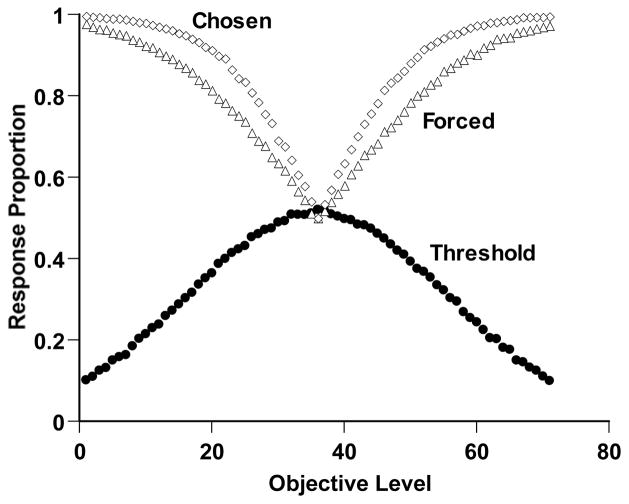
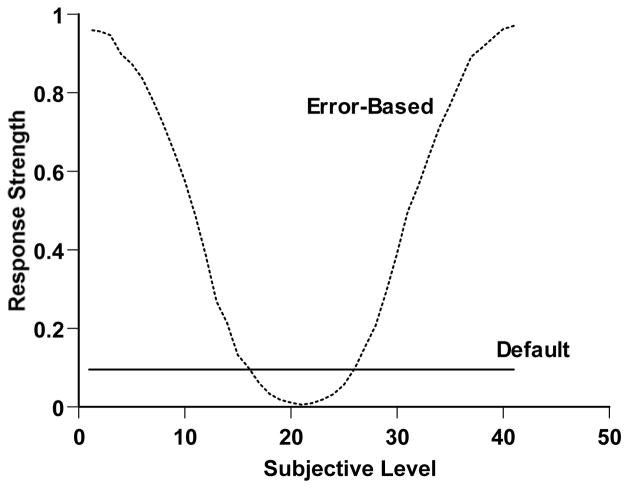
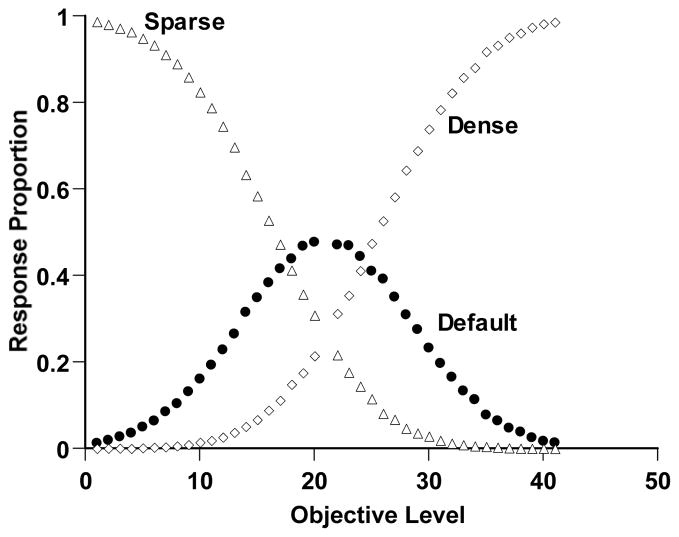
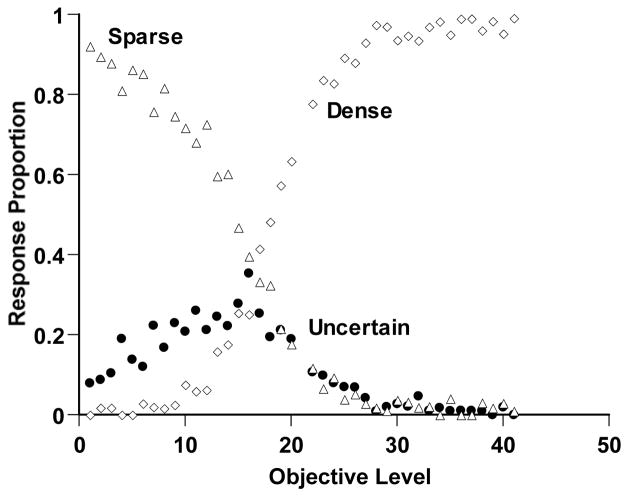
Results that point to animals' metacognitive capacity bear a heavy burden, given the potential for competing behavioral descriptions. In this article, formal models are used to evaluate the force of these descriptions. One example is that many existing studies have directly rewarded so-called uncertainty responses. Modeling confirms that this practice is an interpretative danger because it supports associative processes and encourages simpler interpretations. Another example is that existing studies raise the concern that animals avoid difficult stimuli not because of uncertainty monitored, but because of aversion given error-causing or reinforcement-lean stimuli. Modeling also justifies this concern and shows that this problem is not addressed by the common practice of comparing performance on chosen and forced trials. The models and related discussion have utility for metacognition researchers and theorists broadly, because they specify the experimental operations that will best indicate a metacognitive capacity in humans or animals by eliminating alternative behavioral accounts.


Figures

Figure 1
Figure 1
A signal detection theory (SDT) portrayal of performance in a discrimination task with an uncertain response sometimes allowed. The horizontal axis indicates the subjective impression of the trial. The range of subjective impressions engendered by four objective trial levels is also shown (normal distributions). The observer would obey the two criterion lines, making one or the other primary discrimination response for impressions below the left criterion or above the right criterion. Subjective impressions in between would be declined.
Figure 2
Figure 2
Temporal-duration discrimination performance by a simulated observer in Simulation 1 that performed as illustrated in Figure 1. Details of the simulation are described in the text. The horizontal axis indicates the objective duration of the trial (Levels 1–35 Short; Levels 37–71 Long). The open diamonds and open triangles, respectively, show the proportion correct the observer achieved on the trials it chose to complete or was forced to complete. The filled circles show the proportional use of the uncertainty response for different trial levels.
Figure 3
Figure 3
Sparse-Dense discrimination performance by a simulated observer in Simulation 2. Details of the simulation are described in the text. The horizontal axis indicates the objective density of the trial (Levels 1–20 Sparse, Levels 22–41 Dense). The open triangles and diamonds, respectively, show the proportion of Sparse and Dense responses. The filled circles show the proportional use of the uncertainty response for different trial levels.
Figure 4
Figure 4
A stimulus-generalization/response-strength portrayal of performance in a temporal-duration discrimination with a third response sometimes allowed and directly rewarded. The horizontal axis indicates the subjective impression of the trial. The solid line instantiates the idea that the directly rewarded third response would have a constant response strength or attraction across the range of trial levels. The otted lines instantiate the idea that response strength for the Short and Long responses would wane exponentially going inward away from the task’s anchors (Level 1 and Level 71).
Figure 5
Figure 5
Temporal-duration discrimination performance by a simulated observer in Simulation 3 that performed as illustrated in Figure 4. Details of the simulation are described in the text. The horizontal axis indicates the objective duration of the trial (Levels 1–35 Short; Levels 37–71 Long). The open diamonds and open triangles, respectively, show the proportion correct the observer achieved when it used the most attractive response from among 3 options (Chosen trials) or 2 options (Forced trials). The filled circles show the proportion of trials on which the response strength for the third response was highest.
Figure 6
Figure 6
A reinforcement-history/aversion-avoidance portrayal of performance in a density discrimination with a third response allowed for managing response aversion and avoidance. The horizontal axis indicates the subjective impression of the trial. The solid line instantiates the idea that the third response could be the default option when aversion or avoidance weakens the tendency to respond Sparse or Dense. The dotted line instantiates the idea that response strength for the Sparse and Dense responses would wane exponentially going inward as the frequency of errors increased.
Figure 7
Figure 7
Density discrimination performance by a simulated observer in Simulation 4 that performed as illustrated in Figure 6. Details of the simulation are described in the text. The horizontal axis indicates the objective density of the trial (Levels 1–20 Sparse; Levels 22–41 Dense). The open triangles and diamonds, respectively, show the proportion of Sparse and Dense responses. The filled circles show the proportional use of the third, aversion-avoidance response.
Figure 8
Figure 8
Sparse-Dense discrimination performance by a monkey in the experiment of Smith et al. (2006). The horizontal axis indicates the objective density of the trial (Levels 1–20 Sparse, Levels 22–41 Dense). The open triangles and diamonds, respectively, show the proportion of Sparse and Dense responses. The filled circles show the proportional use of the uncertainty response for different trial levels.
Figure 9
Figure 9
Density discrimination performance by a simulated observer that performed as illustrated in Figure 6. Details of the simulation are described in the text and Appendix. The horizontal axis indicates the objective density of the trial (Levels 1–20 Sparse; Levels 22–41 Dense). The open triangles and diamonds, respectively, show the proportion of Sparse and Dense responses. The filled circles show the proportional use of the third, aversion-avoidance response.

References

    1. Acredolo C, O’Connor J. On the difficulty of detecting cognitive uncertainty. Human Development. 1991;34:204–223.
    1. Beran MJ, Smith JD, Redford JS, Washburn DA. Rhesus macaques (Macaca mulatta) monitor uncertainty during numerosity judgments. Journal of Experimental Psychology: Animal Behavior Processes. 2006;32:111–119. - PubMed
    1. Beran MJ, Smith JD, Coutinho MVC, Couchman JC. The psychological organization of ”uncertainty” responses and “middle” responses: A dissociation in capuchin monkeys (Cebus apella) 2007 Manuscript submitted for publication. - PMC - PubMed
    1. Brown AL, Bransford JD, Ferrara RA, Campione JC. Learning, remembering, and understanding. In: Flavell JH, Markman EM, editors. Handbook of child psychology. Vol. 3. New York: Wiley; 1983. pp. 77–164.
    1. Call J, Carpenter M. Do apes and children know what they have seen? Animal Cognition. 2001;4:207–220.

Publication types

LinkOut - more resources