. 2008 Oct;11(5):525-38.
doi: 10.1080/10255840801930710.

Computational study of growth and remodelling in the aortic arch

Affiliations

Computational study of growth and remodelling in the aortic arch

Patrick W Alford et al. Comput Methods Biomech Biomed Engin. 2008 Oct.

Abstract

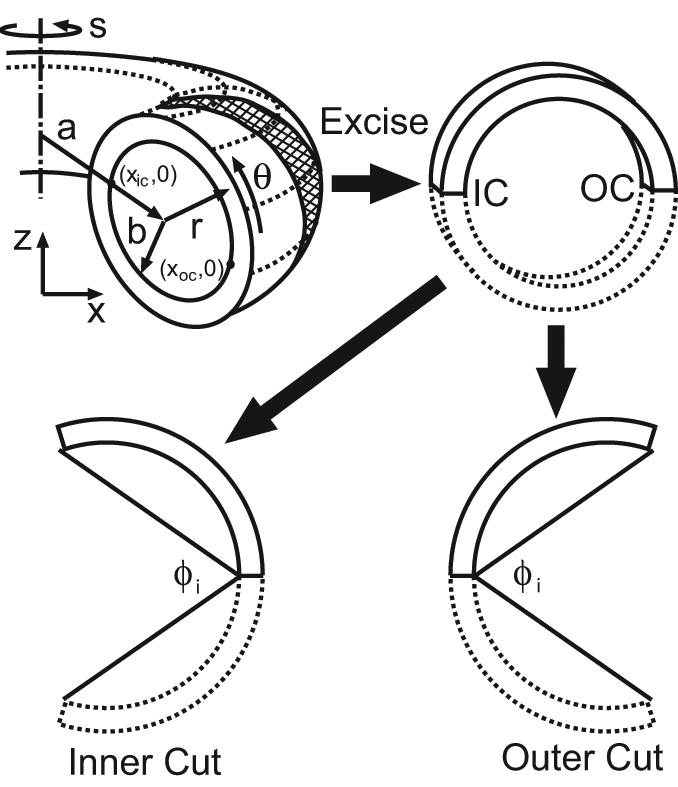
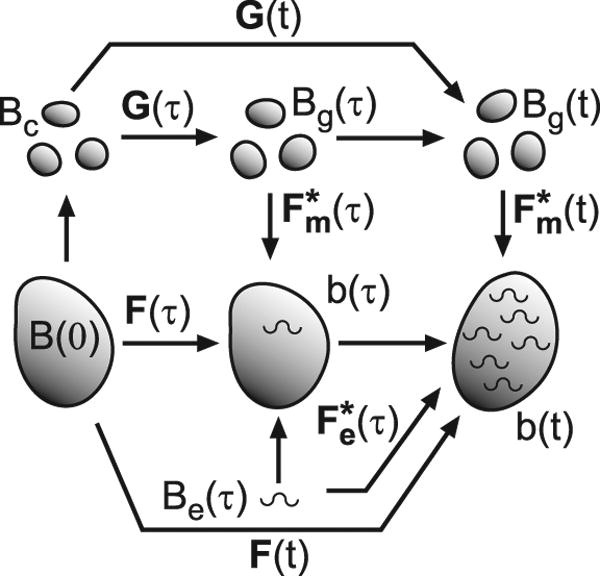
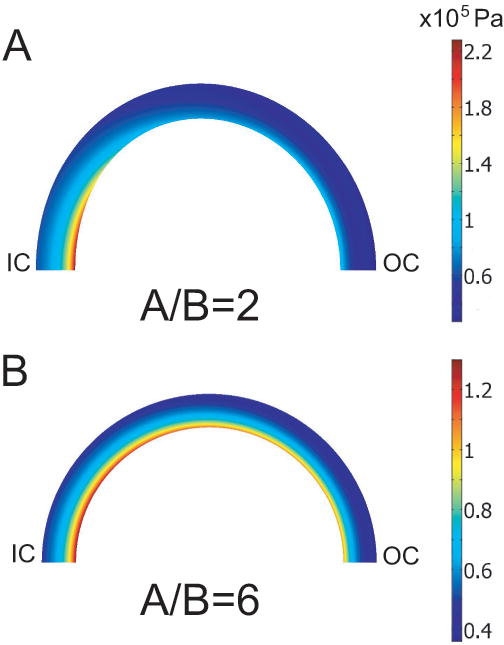
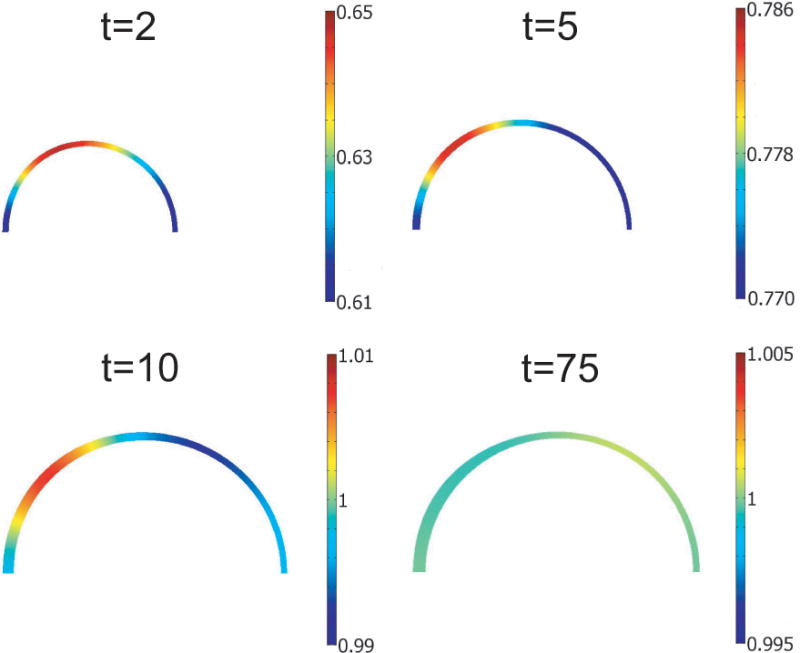
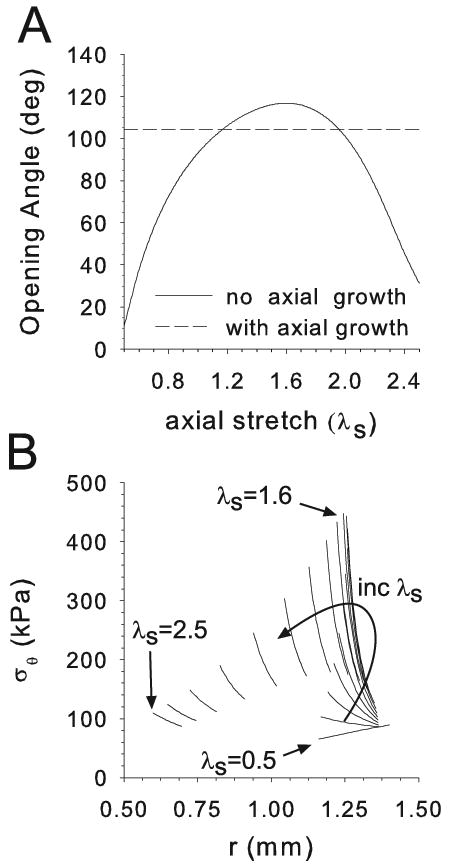
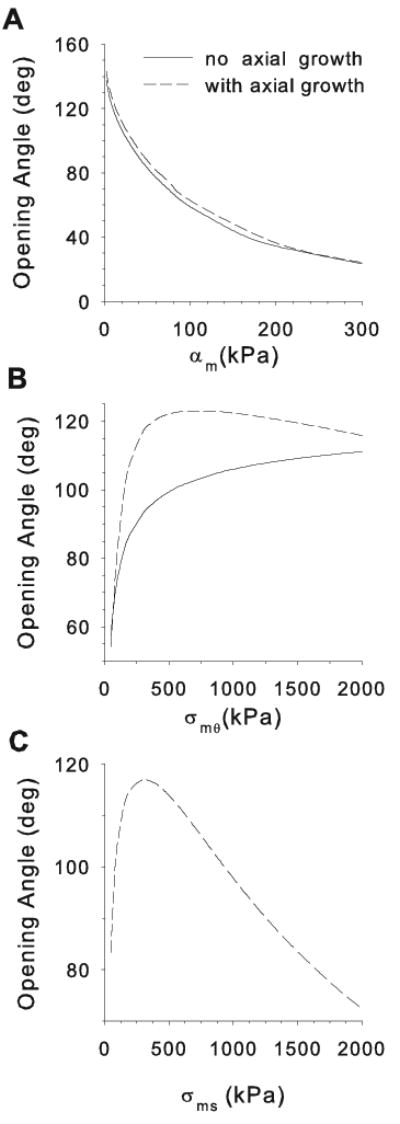
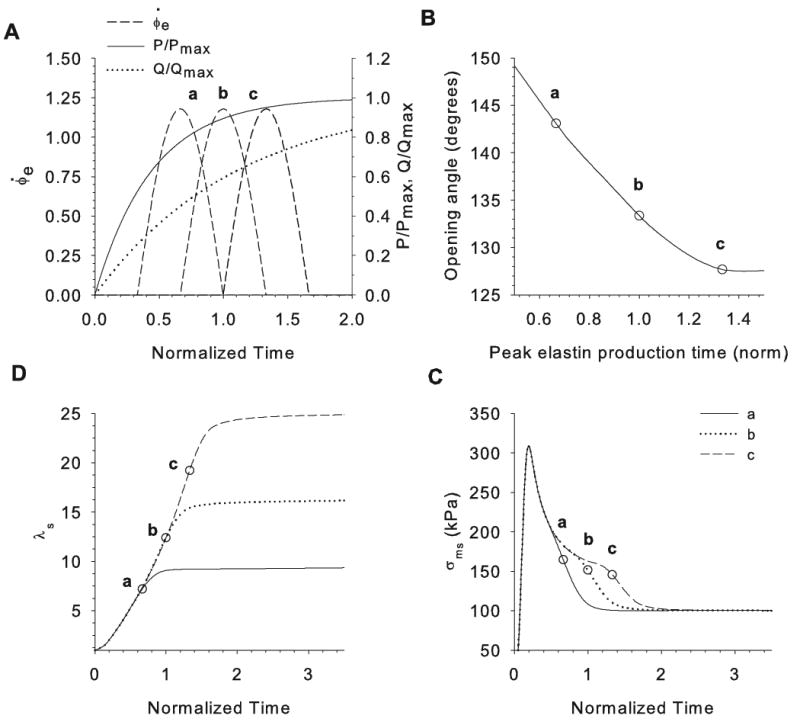
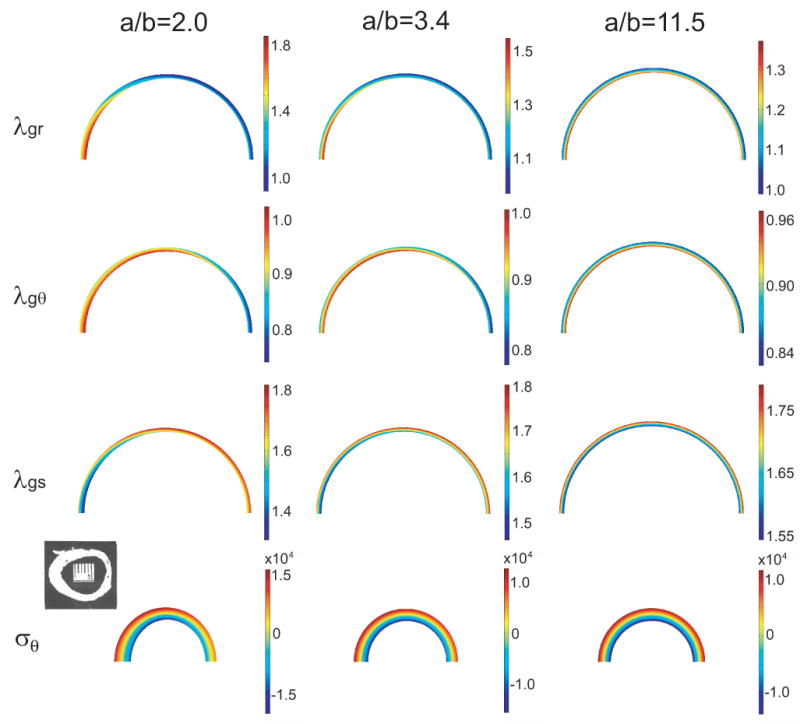
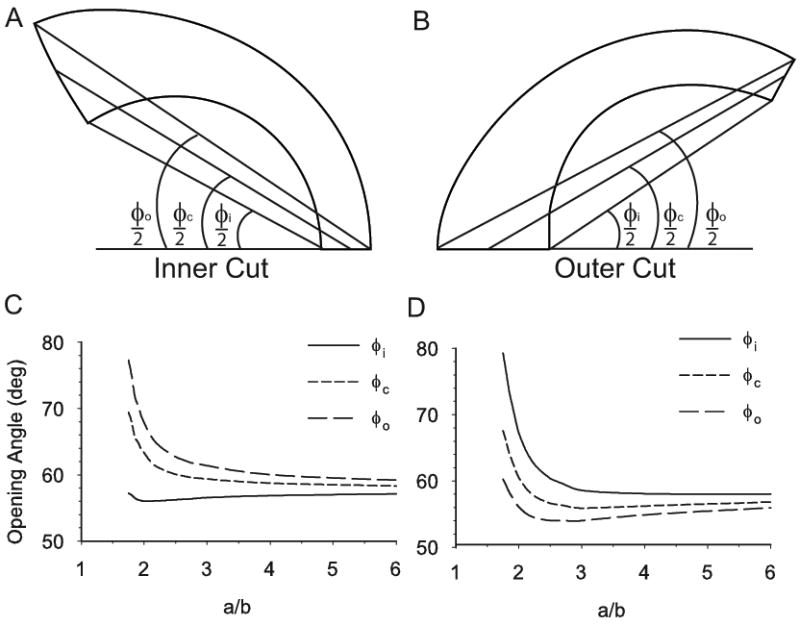
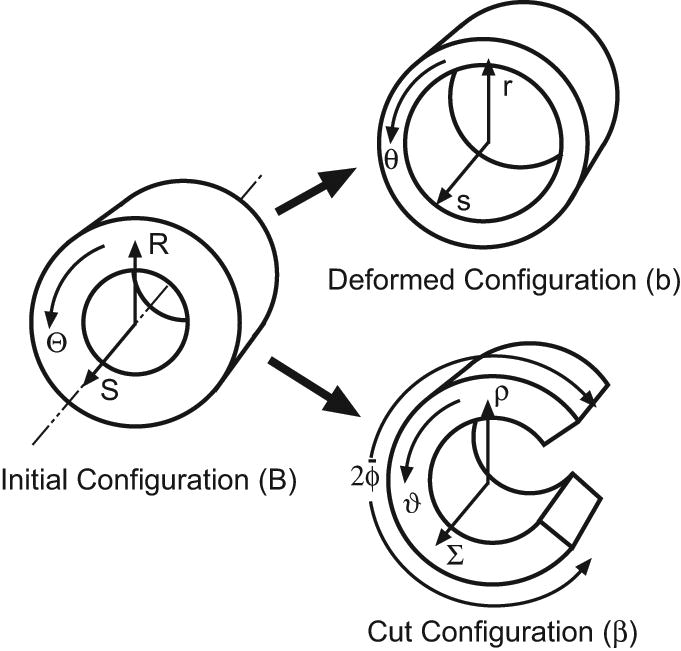
Opening angles (OAs) are associated with growth and remodelling in arteries. One curiosity has been the relatively large OAs found in the aortic arch of some animals. Here, we use computational models to explore the reasons behind this phenomenon. The artery is assumed to contain a smooth muscle/collagen phase and an elastin phase. In the models, growth and remodelling of smooth muscle/collagen depends on wall stress and fluid shear stress. Remodelling of elastin, which normally turns over very slowly, is neglected. The results indicate that OAs generally increase with longitudinal curvature (torus model), earlier elastin production during development, and decreased wall stiffness. Correlating these results with available experimental data suggests that all of these effects may contribute to the large OAs in the aortic arch. The models also suggest that the slow turnover rate of elastin limits longitudinal growth. These results should promote increased understanding of the causes of residual stress in arteries.


Figures

Figure 1
Figure 1
Schematic of torus model and opening angles. Geometry is shown at G&R equilibrium. Inner opening angles φi are shown for radial cuts at the inner curvature (IC) and outer curvature (OC) of the torus (see also Fig. 9A,B). Note: In this paper, the inner curvature always is located on the left side of the cross section.
Figure 2
Figure 2
Configurations for growth and remodeling. Capital Bs represent stress-free configurations; lower case bs are configurations with stresses. For smooth muscle, the total deformation gradient tensor F is decomposed into a growth tensor G and an elastic deformation gradient tensor Fm. Elastin produced at time τ undergoes the elastic deformation Fe. See text for further details.
Figure 3
Figure 3
Circumferential Cauchy stress distributions in pressurized torus. (G&R is not included.) As the curvature increases (A/B decreases), a stress concentration develops near the inner wall at the inner curvature. IC = inner curvature; OC = outer curvature.
Figure 4
Figure 4
Diffusion of endothelial signal in torus model. Normalized signal c/cˆ is shown for four time points during development. As the model reaches G&R equilibrium, c uniformly approaches the target value (t = 75).
Figure 5
Figure 5
Effects of axial stretch in cylinder model C1. (A) Homeostatic opening angle plotted as a function of axial stretch ratio λs, with and without axial growth. (B) Transmural circumferential stress distributions in pressurized cylinder (P = 16 kPa) for various axial stretch ratios. The peak stress occurs at the same stretch ratio (λs ≈ 1.3 in this example) as the peak opening angle for no axial growth.
Figure 6
Figure 6
Effects of smooth muscle modulus (αm) and target stresses (σˆ and σˆms) on opening angle in cylinder model C1. Parameters are varied one at a time from the values αm = 10 kPa, σˆmθ = 300 kPa, and σˆms = 300 kPa. (A) Effects of αm with and without axial growth. (B) Effects of circumferential target stress with and without axial growth. (C) Effects of axial target stress with axial growth.
Figure 7
Figure 7
Effects of elastin production time on opening angles in cylinder model C2. (A) Pressure P, flow rate Q, and three example elastin production-rate curves (a, b, c) are plotted as functions of time during development. Time is normalized by the time of birth. (B) Opening angle plotted as a function of peak elastin production time. (C) Axial stretch ratio plotted as a function of time for cases a, b, and c. (D) Axial stress of smooth muscle at inner radius of artery plotted as a function of time for cases a, b, and c. Circles in B–D indicate the peak elastin production time for cases a, b, and c.
Figure 8
Figure 8
Growth and residual stress in torus model T2 at G&R equilibrium. Growth in the radial (λgr), circumferential (λ), and axial (λgs) directions (loaded artery) and circumferential residual stress (σθ, unloaded artery) are shown for three values of the normalized radius of curvature a/b. For each case, b = 1.5 mm at G&R equilibrium. Note: In the reference configuration, the corresponding values are A/B = 2.3, 4.0, and 13.3. Inset: Section of unloaded porcine aortic arch; reprinted from Han and Fung (1991) with permission of ASME.
Figure 9
Figure 9
Effect of longitudinal curvature on homeostatic opening angles in torus model T1. Due to inhomogeneous wall thickness, opening angles measured at the inside φi), center (φc), and outside (φo) of the wall are different. (A,B) Examples of opening angles for cuts at inner and outer curvature of vessel. Cut sections are given by the model. (C,D) Opening angles are plotted as functions of the normalized longitudinal radius of curvature a/b with b = 1.5 mm.
Figure 10
Figure 10
Configurations for cylinder model. Growth, remodeling, and applied loads deform the cylinder from initial configuration B to deformed configuration b. When a transmural cut is made in the unloaded artery, the section springs open, yielding the cut configuration β.

References

    1. Alford PW, Humphrey JD, Taber LA. Growth and remodeling in a thick-walled artery model: effects of spatial variations in wall constituents. Biomechanics and Modeling in Mechanobiology. 2007 in press. - PMC - PubMed
    1. Chuong CJ, Fung YC. On Residual Stresses in Arteries. J Biomech Eng. 1986;108:189–192. - PubMed
    1. Dajnowiec D, Sabatini PJ, Van Rossum TC, Lam JT, Zhang M, Kapus A, Langille BL. Force-induced polarized mitosis of endothelial and smooth muscle cells in arterial remodeling. Hypertension. 2007;50:255–260. - PubMed
    1. Davidson JM, Hill KE, Alford JL. Developmental changes in collagen and elastin biosynthesis in the porcine aorta. Dev Biol. 1986;118:103–111. - PubMed
    1. Davis EC. Stability of elastin in the developing mouse aorta: a quantitative radioauto-graphic study. Histochemistry. 1993;100:17–26. - PubMed

Publication types

LinkOut - more resources