Review
. 2008:45:121-33.
doi: 10.1042/BSE0450121.

Single live-cell imaging for systems biology

Affiliations
Review

Single live-cell imaging for systems biology

Dhanya Mullassery et al. Essays Biochem. 2008.

Abstract

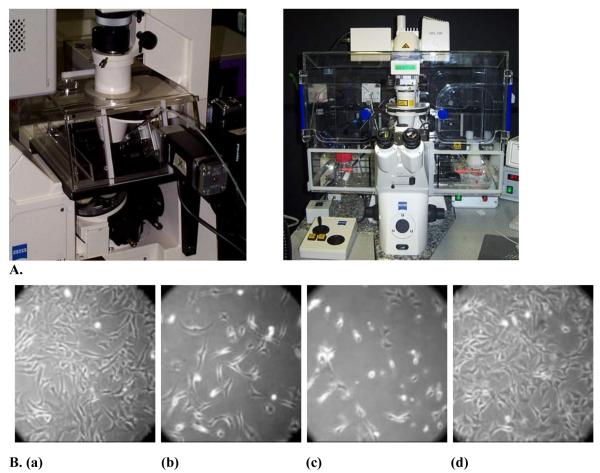
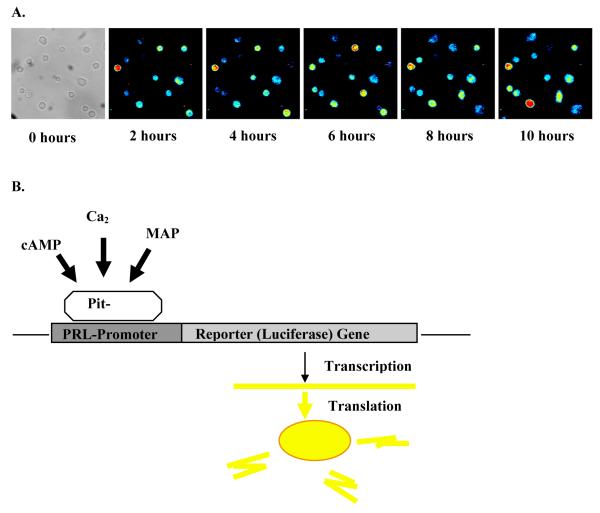
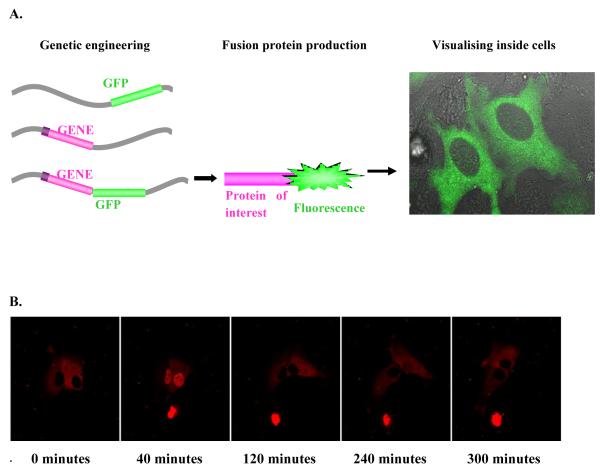
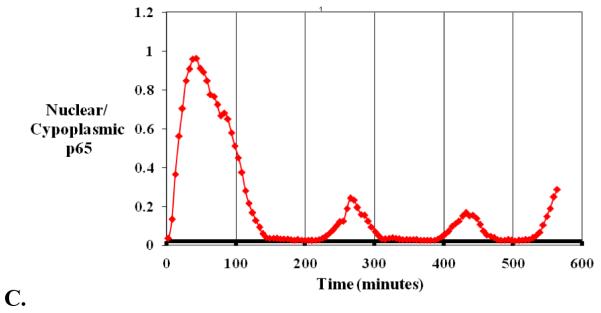
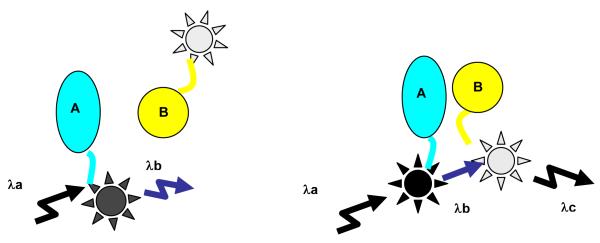
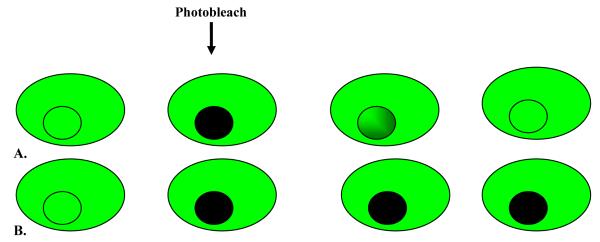
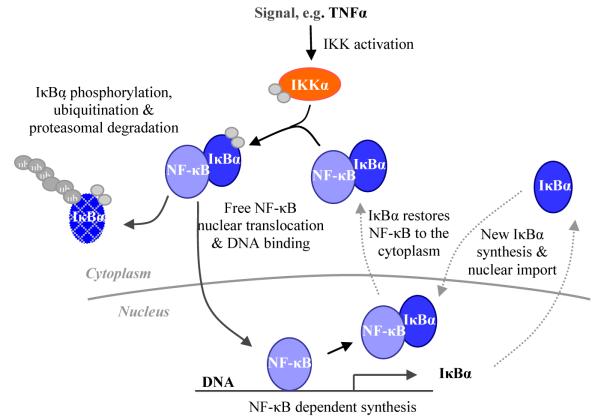
Understanding how mammalian cells function requires a dynamic perspective. However, owing to the complexity of signalling networks, these non-linear systems can easily elude human intuition. The central aim of systems biology is to improve our understanding of the temporal complexity of cell signalling pathways, using a combination of experimental and computational approaches. Live-cell imaging and computational modelling are compatible techniques which allow quantitative analysis of cell signalling pathway dynamics. Non-invasive imaging techniques, based on the use of various luciferases and fluorescent proteins, trace cellular events such as gene expression, protein-protein interactions and protein localization in cells. By employing a number of markers in a single assay, multiple parameters can be measured simultaneously in the same cell. Following acquisition using specialized microscopy, analysis of multi-parameter time-lapse images facilitates the identification of important qualitative and quantitative relationships-linking intracellular signalling, gene expression and cell fate.


Figures

Figure 1
Figure 1
A) Two examples of incubators attached to microscopes for maintaining the temperature at 37° C and CO2 concentration at 5 %. B) The effect of temperature on Swiss 3T3 cells in culture: (a) Grown in a conventional incubator at 37°C, for 72 hours, or on a microscope at actual temperatures of (b) 35°C (c) 39°C or (d) 37°C.
Figure 2
Figure 2
Live cell luminescence microscopy. A) Tracking human prolactin transcription over time following stimulation with 5 μM forskolin. Time lapse microscopy images of GH3 cells, transfected with a 13kd human prolactin promoter luciferase reporter construct. B) Diagramatic representation of live cell luminescence microscopy. Activation of prolactin is visualised as light production resulting from the transcription of the reporter (luciferase) gene.
Figure 3
Figure 3
Live cell fluorescence confocal microscopy. A) Diagramatic version of fusion protein formation. Integrating the fluorescence gene next to the gene of interest in the chosen cell, formation of a fusion protein and visualisation of the protein of interest by the attached fluorescent tag using a microscope. B) Time lapse confocal fluorescence microscopic images of SK-N-AS neuroblastoma cells transfected with a p65-dsred xp expression vector following TNFα stimulation. C) Quantification of protein translocation as nuclear/cytoplasmic fluorescence from the same cell.
Figure 3
Figure 3
Live cell fluorescence confocal microscopy. A) Diagramatic version of fusion protein formation. Integrating the fluorescence gene next to the gene of interest in the chosen cell, formation of a fusion protein and visualisation of the protein of interest by the attached fluorescent tag using a microscope. B) Time lapse confocal fluorescence microscopic images of SK-N-AS neuroblastoma cells transfected with a p65-dsred xp expression vector following TNFα stimulation. C) Quantification of protein translocation as nuclear/cytoplasmic fluorescence from the same cell.
Figure 4
Figure 4
Diagrammatic representation of FRET. FRET describes an energy transfer mechanism between two chromophores. A donor chromophore in its excited state can transfer energy to an acceptor chromophore in close proximity (typically <10 nm). For monitoring the complex formation between two molecules, one of them is labeled with a donor and the other with an acceptor, and these fluorophore-labeled molecules are mixed. When they are dissociated, the donor emission is detected upon the donor excitation. On the other hand, when the donor and acceptor are closer (<10 nm), the acceptor takes the energy from the donor and emit photons of different color.
Figure 5
Figure 5
Diagrammatic representation of FRAP. A fluophore (eg, GFP) is covalently attached to the molecule of interest. The fluorescently tagged molecules are visualised using a microscope and photobleached. Now there is a black area filled with photobleached molecules surrounded by fluorescently tagged molecules that have not been photobleached. If these molecules are able to diffuse, this will cause the fluorescent area to become a little less bright, and the blackened area will gradually increase in brightness as fluorescent molecules migrate into this area. A) GFP tagged molecules from outside the marked area moving in after photobleaching of selected area. B) No movement of GFP tagged molecules into selected region after initial photobleach.
Figure 6
Figure 6
Simplified diagrammatic representation of the NF-κB pathway. A signal (e.g. TNFα) activates IKK which phosphorylates IκBα, resulting in its phosphorylation and degradation. This releases active NF-κB to translocate to the nucleus and regulate target genes including IκBα. New IκBα forms a negative feedback loop which restores NF-κB to the cytoplasm.

References

    1. Tyson JJ, Chen KC, Novak B. Sniffers, buzzers, toggles and blinkers: dynamics of regulatory and signaling pathways in the cell. Curr Opin Cell Biol. 2003;15(2):221–31. - PubMed
    1. Phair RD, Misteli T. Kinetic modelling approaches to in vivo imaging. Nat Rev Mol Cell Biol. 2001;2(12):898–907. - PubMed
    1. Goldman RD, Spector DL, editors. Live Cell Imaging: A laboratory manual. Cold Spring Harbour Laboratory Press; 2005.
    1. Rutter GA, et al. Real-time imaging of gene expression in single living cells. Chem Biol. 1998;5(11):R285–90. - PubMed
    1. Stirland JA, et al. Real-time imaging of gene promoter activity using an adenoviral reporter construct demonstrates transcriptional dynamics in normal anterior pituitary cells. J Endocrinol. 2003;178(1):61–9. - PubMed

Publication types