

BOV--a web-based BLAST output visualization tool
- PMID: 18793422
- PMCID: PMC2566317
- DOI: 10.1186/1471-2164-9-414
BOV--a web-based BLAST output visualization tool
Abstract
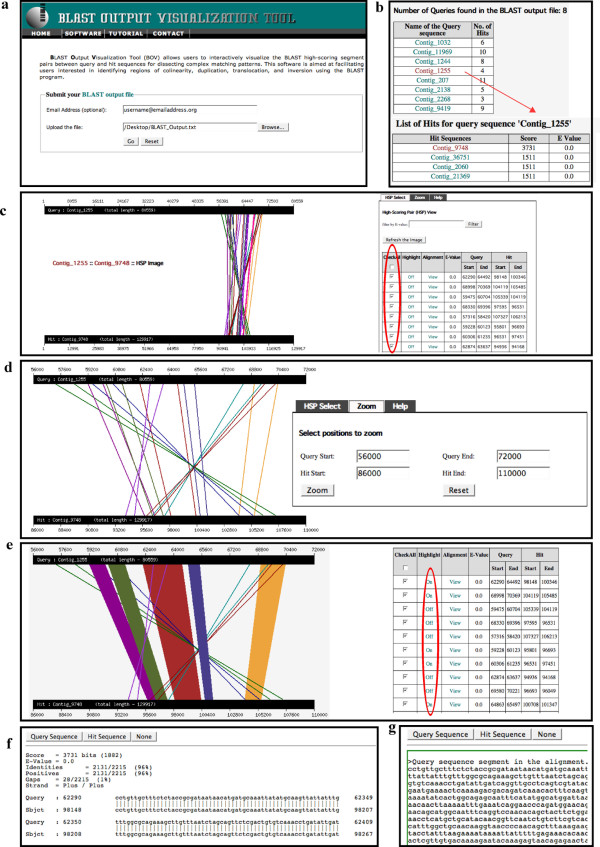
Background: The BLAST program is one of the most widely used sequence similarity search tools for genomic research, even by those biologists lacking extensive bioinformatics training. As the availability of sequence data increases, more researchers are downloading the BLAST program for local installation and performing larger and more complex tasks, including batch queries. In order to manage and interpret the results of batch queries, a host of software packages have been developed to assist with data management and post-processing. Among these programs, there is almost a complete lack of visualization tools to provide graphic representation of complex BLAST pair-wise alignments. We have developed a web-based program, BLAST Output Visualization Tool (BOV), that allows users to interactively visualize the matching regions of query and database hit sequences, thereby allowing the user to quickly and easily dissect complex matching patterns.
Results: Users can upload the standard BLAST output in pair-wise alignment format as input to the web server (including batch queries generated installing and running the stand-alone BLAST program on a local server). The program extracts the alignment coordinates of matching regions between the query and the corresponding database hit sequence. The coordinates are used to plot each matching region as colored lines or trapezoids. Using the straightforward control panels throughout the web site, each plotted matching region can be easily explored in detail by, for example, highlighting the region of interest or examining the raw pair-wise sequence alignment. Tutorials are provided at the website to guide users step-by-step through the functional features of BOV.
Conclusion: BOV provides a user-friendly web interface to visualize the standard BLAST output for investigating wide-ranging genomic problems, including single query and batch query datasets. In particular, this software is valuable to users interested in identifying regions of co-linearity, duplication, translocation, and inversion among sequences. A web server hosting BOV is accessible via http://bioportal.cgb.indiana.edu/cgi-bin/BOV/index.cgi and the software is freely available for local installations.
Figures
Similar articles
-
WebGBrowse--a web server for GBrowse.Bioinformatics. 2009 Jun 15;25(12):1550-1. doi: 10.1093/bioinformatics/btp239. Epub 2009 Apr 8. Bioinformatics. 2009. PMID: 19357095
-
Windows .NET Network Distributed Basic Local Alignment Search Toolkit (W.ND-BLAST).BMC Bioinformatics. 2005 Apr 8;6:93. doi: 10.1186/1471-2105-6-93. BMC Bioinformatics. 2005. PMID: 15819992 Free PMC article.
-
PLAN: a web platform for automating high-throughput BLAST searches and for managing and mining results.BMC Bioinformatics. 2007 Feb 9;8:53. doi: 10.1186/1471-2105-8-53. BMC Bioinformatics. 2007. PMID: 17291345 Free PMC article.
-
ViroBLAST: a stand-alone BLAST web server for flexible queries of multiple databases and user's datasets.Bioinformatics. 2007 Sep 1;23(17):2334-6. doi: 10.1093/bioinformatics/btm331. Epub 2007 Jun 22. Bioinformatics. 2007. PMID: 17586542
-
An overview of online resources for intra-species detection of gene duplications.Front Genet. 2022 Oct 13;13:1012788. doi: 10.3389/fgene.2022.1012788. eCollection 2022. Front Genet. 2022. PMID: 36313461 Free PMC article. Review.
Cited by
-
Toll-like receptor 4 promoter polymorphisms: common TLR4 variants may protect against severe urinary tract infection.PLoS One. 2010 May 20;5(5):e10734. doi: 10.1371/journal.pone.0010734. PLoS One. 2010. PMID: 20505764 Free PMC article.
-
The PARIGA server for real time filtering and analysis of reciprocal BLAST results.PLoS One. 2013 May 7;8(5):e62224. doi: 10.1371/journal.pone.0062224. Print 2013. PLoS One. 2013. PMID: 23667459 Free PMC article.
-
A software pipeline for processing and identification of fungal ITS sequences.Source Code Biol Med. 2009 Jan 15;4:1. doi: 10.1186/1751-0473-4-1. Source Code Biol Med. 2009. PMID: 19146660 Free PMC article.
References
-
- Dong Q, Brendel V. Computational identification of related proteins: BLAST, PSI-BLAST, and other tools. In: Walker JM, editor. The Proteomics Protocols Handbook. Humana Press; 2005. pp. 555–570.
-
- Xing L, Brendel V. Multi-query sequence BLAST output examination with MuSeqBox. Bioinformatics. 2001;17:744–745. - PubMed
Publication types
MeSH terms
LinkOut - more resources
Full Text Sources
Research Materials
Miscellaneous
