. 2008 Sep 15;68(18):7520-9.
doi: 10.1158/0008-5472.CAN-08-1060.

Prevention of both direct and cross-priming of antitumor CD8+ T-cell responses following overproduction of prostaglandin E2 by tumor cells in vivo

Affiliations

Prevention of both direct and cross-priming of antitumor CD8+ T-cell responses following overproduction of prostaglandin E2 by tumor cells in vivo

Maryam Ahmadi et al. Cancer Res. .

Abstract

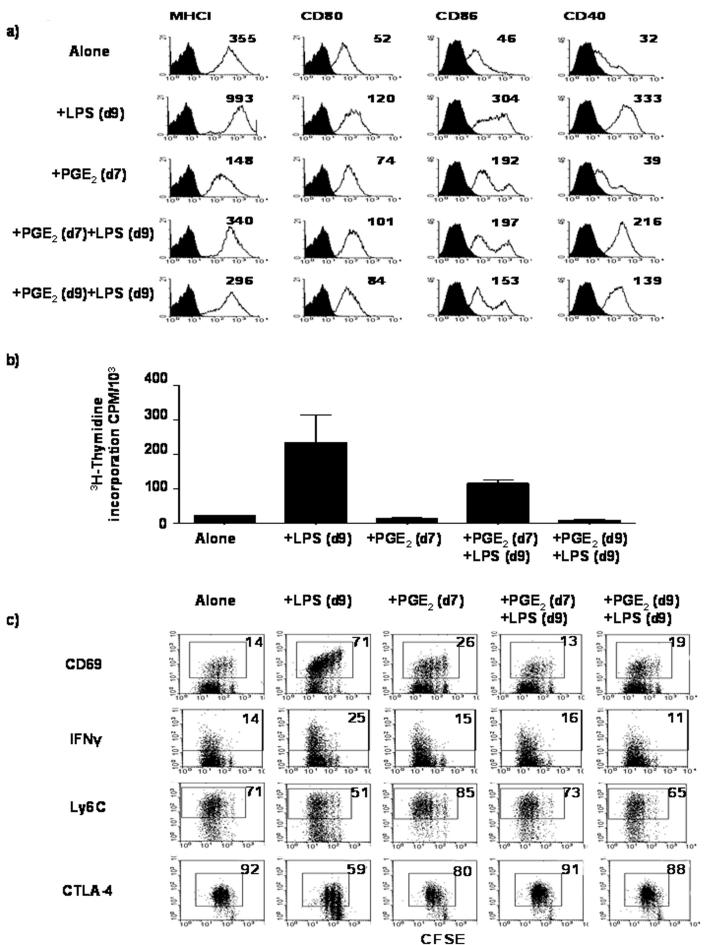
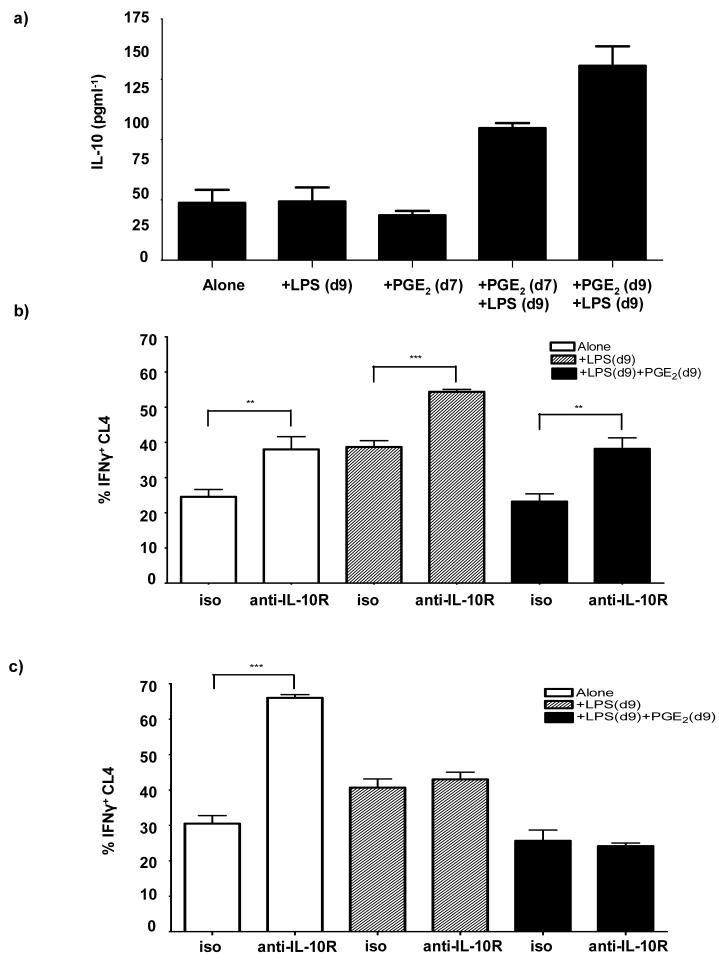
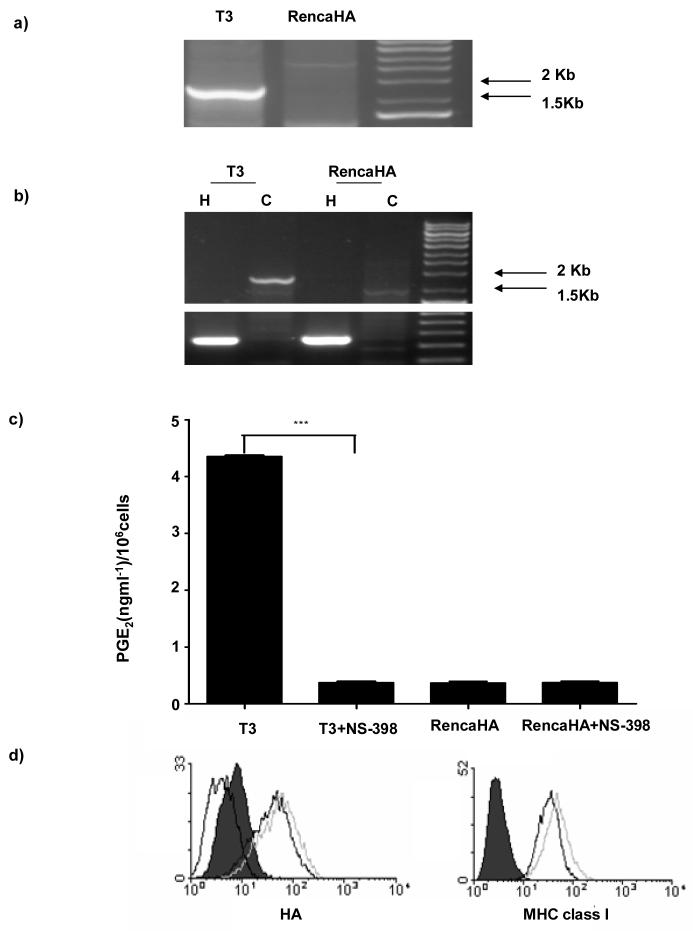
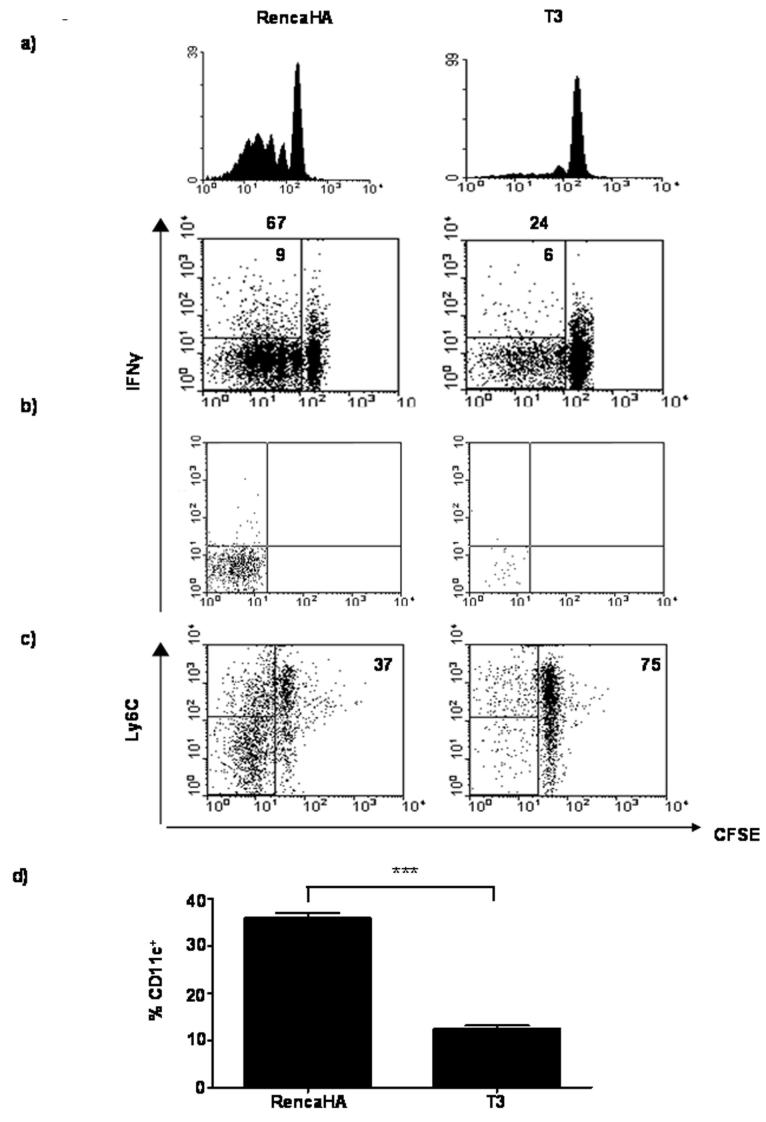
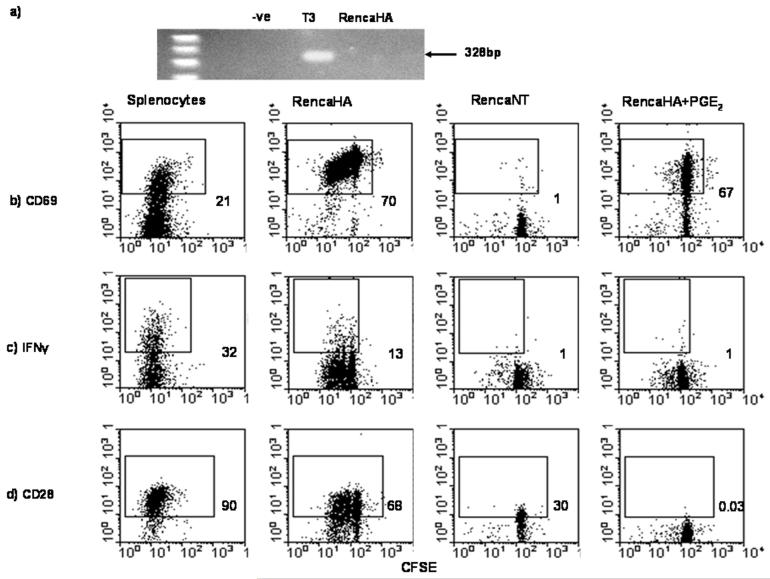
Defects in antitumor immune responses have been associated with increased release of prostaglandin E(2) (PGE(2)) as a result of overexpression of cyclooxygenase (COX)-2 by tumors. In this report, we examine the effects of PGE(2) on antitumor CD8(+) T-cell responses generated both by cross-presenting dendritic cells and by direct priming by tumor cells. Our data show that PGE(2) inhibits dendritic cell maturation, resulting in the abortive activation of naive CD8(+) T cells, and is dependent on interleukin-10 production by dendritic cells. Interaction of tumor cells with naïve CD8(+) T cells in the presence of PGE(2) in vitro results in the induction of CD8(+) CD28(-) T cells, which fail to proliferate or exhibit effector function. In vivo, overexpression of COX-2 by tumor cells results in a decrease in number of tumor-infiltrating dendritic cells and confers the ability of tumor cells to metastasize to the tumor draining lymph nodes.


Figures

Figure 1
Figure 1. PGE2-treated DC induce abortive activation of CL4 cells in vitro
a) iDC were either left untreated (Alone), treated with 1μg/ml LPS for 18hrs on day 9 (+LPS(d9)), treated with PGE2 (10-6 M) alone on day 7 (+PGE2(d7)), or treated with PGE2 (10-6 M) on day 7 followed by LPS on day 9 (+PGE2(d7)+LPS(d9)). Cells were alternatively treated with a mixture of PGE2-LPS on day 9 (+PGE2(d9)+LPS(d9)). Cells harvested on day 10 were analyzed by flow cytometry, for cell surface receptor expression as indicated in the figure (open histograms). Filled histograms represent isotype controls. The data are from one of eight performed experiments. Numbers in each histogram represents the mean fluorescence intensity (MFI). b) CL4 proliferation as measured by 3H-thymidine incorporation after co-culture with iDC treated as described in a. The data are mean ± SD, from one of three performed experiments, each with triplicates. c) Phenotypic analyses of Thy1.1+ CFSE labeled CL4 cells after co-culture with iDC treated as described in a). Numbers indicate the percentage of divided CL4 cells expressing the receptors as indicated in the figure. The data are from one of two performed experiments.
Figure 2
Figure 2. Blocking IL-10 in vitro reverses the inhibitory effects of PGE2 on DC function
a) iDC were either left untreated (Alone), treated with 1μg/ml LPS for 18hrs on day 9 (+LPS(d9)), treated with PGE2 (10-6 M) alone on day 7 (+PGE2(d7)), or treated with PGE2 (10-6 M) on day 7 followed by LPS on day 9 (+PGE2(d7)+LPS(d9)). Cells were alternatively treated with a mixture of PGE2-LPS on day 9 (+PGE2(d9)+LPS(d9)). Histogram represents IL-10 production by DC treated as indicated in the figure. The data are mean ± SD, from one of two performed experiments, each with triplicates. b) iDC left untreated (Alone), treated with LPS alone on day 9 [+LPS(d9)], or PGE2 and LPS on day 9 [+PGE2(d9)+LPS(d9)] were further treated with purified anti-IL-10R mAb or an isotype control (iso) on day 9; before being washed and co-cultured with CFSE-labeled, naïve Thy1.1+, CL4 cells. Histograms represents %IFN-γ+ CL4 cells isolated from the DC co-cultures, as indicated in the figure. Data, represent the average from two experiments ± SD, performed in triplicate wells. c) Alternatively, iDC left untreated (Alone), treated with LPS alone on day 9 [+LPS(d9)], or PGE2 and LPS on day 9 [+PGE2(d9)+LPS(d9)] were cultured with naïve, CFSE labeled Thy1.1+ CL4 cells and the DC-CL4 cell co-cultures were treated with the anti-IL-10R mAb or the isotype control (iso). Histograms represent %IFN-γ+ CL4 cells isolated from DC co-cultures as indicated in the figure. Data, represent the average from two experiments ± SD, performed in triplicate wells. ** P between 0.001 & 0.01; *** P< 0.001
Figure 3
Figure 3. Characterization of RencaHA and T3 cell lines
a) PCR, showing the presence of the transfected COX-2 cDNA, and b) RT-PCR, showing expression of COX-2 by RencaHA and T3 cell lines. H represents the house keeping gene hypoxanthine phospho-ribosyl transferase (HPRT) and C represents COX-2. c) PGE2 produced by T3 and RencaHA cell lines in vitro left untreated or treated with 5μg/ml NS-398, as measured by ELISA. d) HA and MHC Class I expression by T3 and RencaHA was measured by flow cytometry. Black line represents expression on RencaHA cells, grey line represents expression on T3 cell line and dotted line (HA expression only) represents expression on RencaNT cell line. Filled histogram represents control secondary mAb alone. The data are from one of six performed experiments. *** P< 0.001.
Figure 4
Figure 4. CL4 cells fail to proliferate in response to T3 in vivo
Thy1.2+ BALB/c mice were injected s.c. with RencaHA or T3 tumor cells. On day 11, mice were given 3×10⁶ naïve, CFSE-labeled Thy1.1+ CL4 cells i.v. and on day 16, or 21 cells obtained from the TDLN or the tumor, respectively, were stained for Thy1.1. Data represent proliferation and IFN-γ among CL4 cells isolated from TDLN (a), and intracellular straining of IFN-γ among CL4 cells isolated from the tumor (b). Histograms and dot plots are gated on Thy1.1+ CL4 cells collected from equal number of lymphocytes and total TIL. Numbers above the plots indicate the percentage of divided CL4 cells, and in the top left quadrants, the percentage of CL4 cells that are IFN-γ+. The data are from one of three performed experiments. c) Dot plots represent Ly6C expression on divided CL4 cells isolated from the TDLN of T3 and RencaHA tumor bearing mice. Plots are gated on Thy1.1+ CL4 cells. The data are from one of two performed experiments which utilized three animals per group. d) Accumulation of DC within the tumors extracted from the T3 or RencaHA bearing mice as described in (a). Histogram shows percentage of CD11c+ cells amongst total cells collected. The data are from one of two performed experiments ± SD, which utilized three mice per group. *** P< 0.001
Figure 5
Figure 5. Exogenous PGE2 abrogates direct activation of CL4 cells by tumor cells
TDLN of mice injected with RencaHA or T3 tumor cells followed by naïve CL4 cells, as described in Figure 4, were excised on day 16 and analysed for the presence of HA by RT-PCR (a). RencaHA, RencaNT or peptide-pulsed splenocytes, in the presence or absence of PGE2, were co-cultured with naïve, CFSE-labeled Thy1.1+ CL4 cells for 72hrs and b) CD69 expression, c) IFN-γ production and d) CD28 expression by CL4 cells isolated from in vitro cultures were examined by flow cytometry. Dot plots are gated on Thy1.1+ CL4 cells and numbers indicate percentage divided CL4 cells expressing the receptor indicated in the figure. The data are from one of three performed experiments.

Similar articles

Cited by

References

    1. Almand B, Resser JR, Lindman B, et al. Clinical significance of defective dendritic cell differentiation in cancer. Clin Cancer Res. 2000;6:1755–66. - PubMed
    1. Enk AH, Jonuleit H, Saloga J, Knop J. Dendritic cells as mediators of tumor-induced tolerance in metastatic melanoma. Int J Cancer. 1997;73:309–16. - PubMed
    1. Enk AH, Angeloni VL, Udey MC, Katz SI. Inhibition of Langerhans cell antigen-presenting function by IL-10. A role for IL-10 in induction of tolerance. J Immunol. 1993;151:2390–8. - PubMed
    1. Gabrilovich DI, Ciernik IF, Carbone DP. Dendritic cells in antitumor immune responses. I. Defective antigen presentation in tumor-bearing hosts. Cell Immunol. 1996;170:101–10. - PubMed
    1. Menetrier-Caux C, Bain C, Favrot MC, Duc A, Blay JY. Renal cell carcinoma induces interleukin 10 and prostaglandin E2 production by monocytes. Br J Cancer. 1999;79:119–30. - PMC - PubMed

Publication types

MeSH terms