

Greater nicotinic acetylcholine receptor density in smokers than in nonsmokers: a PET study with 2-18F-FA-85380
- PMID: 18794265
- PMCID: PMC2766917
- DOI: 10.2967/jnumed.108.050716
Greater nicotinic acetylcholine receptor density in smokers than in nonsmokers: a PET study with 2-18F-FA-85380
Abstract
Assays of human postmortem brain tissue have revealed that smokers have greater densities of high-affinity nicotinic acetylcholine receptors (nAChRs) in several brain regions than do nonsmokers or exsmokers. Quantitative PET imaging of nAChRs in humans has recently been reported using the alpha4beta2* subtype-specific radioligand 2-(18)F-FA-85380 (2FA).
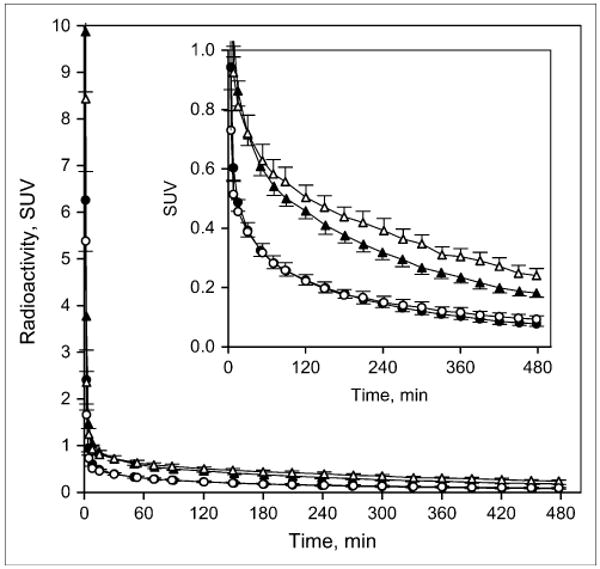
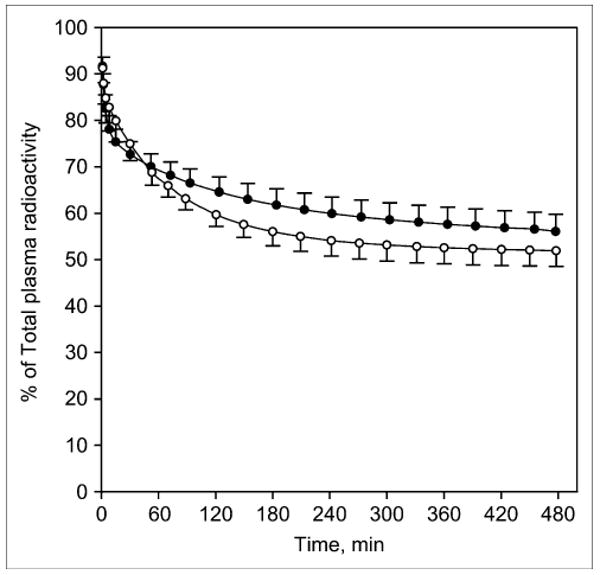
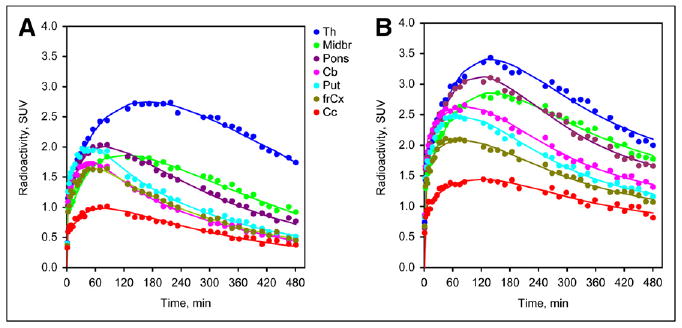
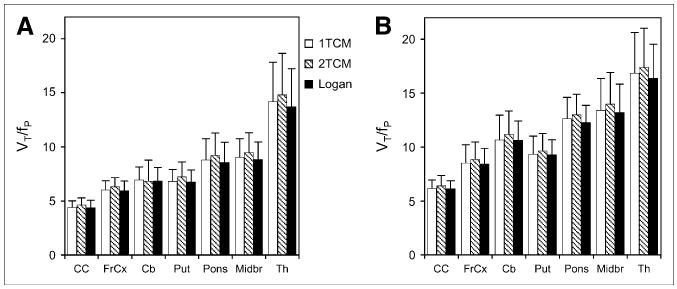
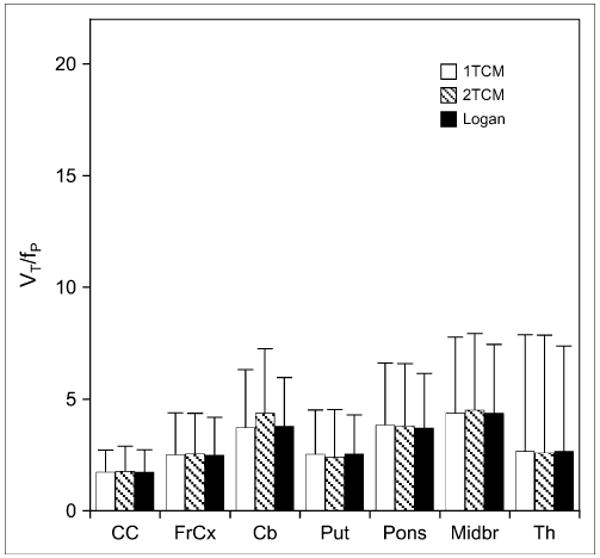
Methods: We used PET and 2FA to measure total volumes of distribution corrected for the free fraction of 2FA in plasma (V(T)/f(P)) in 10 nonsmokers and 6 heavy smokers (>14 cigarettes/d; abstinent for >36 h). Dynamic PET scans were performed over 8 h, commencing immediately after a bolus injection of 2FA. Anatomic sampling was performed on PET images that were coregistered to MR images acquired from each volunteer. Data were analyzed by Logan plots and by 1- and 2-tissue-compartment models using unbound, unmetabolized arterial 2FA concentration as the input function.
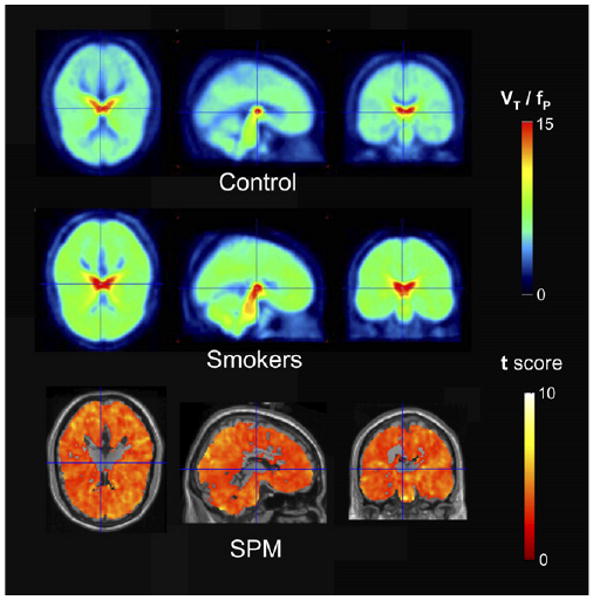
Results: All modeling methods yielded similar results. V(T)/f(P) was significantly higher in smokers than in nonsmokers in all brain regions tested, except the thalamus. We used measures of V(T)/f(P) and estimates of nondisplaceable volume of distribution and found 25%-200% higher values in smokers than in nonsmokers for the volume of distribution for the specific binding compartment in the frontal cortex, midbrain, putamen, pons, cerebellum, and corpus callosum. These findings were consistent with voxel-based analysis using statistical parametric mapping.
Conclusion: Our findings suggest that PET with 2FA can be used to study the role of nicotine-induced upregulation of nAChRs in active smokers and during smoking cessation.
Figures
Similar articles
-
Quantification of nicotinic acetylcholine receptors in the human brain with PET: bolus plus infusion administration of 2-[18F]F-A85380.Neuroimage. 2008 Jan 15;39(2):717-27. doi: 10.1016/j.neuroimage.2007.09.015. Epub 2007 Sep 19. Neuroimage. 2008. PMID: 17962044 Free PMC article.
-
Positron emission tomography experience with 2-[¹⁸F]fluoro-3-(2(S)-azetidinylmethoxy)pyridine (2-[¹⁸F]FA) in the living human brain of smokers with paranoid schizophrenia.Synapse. 2012 Apr;66(4):352-68. doi: 10.1002/syn.21520. Epub 2011 Dec 29. Synapse. 2012. PMID: 22169936 Free PMC article.
-
First-in-human PET quantification study of cerebral α4β2* nicotinic acetylcholine receptors using the novel specific radioligand (-)-[(18)F]Flubatine.Neuroimage. 2015 Sep;118:199-208. doi: 10.1016/j.neuroimage.2015.05.065. Epub 2015 May 30. Neuroimage. 2015. PMID: 26037057
-
Decreased Nicotinic Receptor Availability in Smokers with Slow Rates of Nicotine Metabolism.J Nucl Med. 2015 Nov;56(11):1724-9. doi: 10.2967/jnumed.115.155002. Epub 2015 Aug 13. J Nucl Med. 2015. PMID: 26272810 Free PMC article.
-
Recent PET radioligands with optimal brain kinetics for imaging nicotinic acetylcholine receptors.J Labelled Comp Radiopharm. 2013 Mar-Apr;56(3-4):159-66. doi: 10.1002/jlcr.3020. J Labelled Comp Radiopharm. 2013. PMID: 24285321 Review.
Cited by
-
Effects of chronic exposure to cigarette smoke on canonical transient receptor potential expression in rat pulmonary arterial smooth muscle.Am J Physiol Cell Physiol. 2014 Feb 15;306(4):C364-73. doi: 10.1152/ajpcell.00048.2013. Epub 2013 Dec 11. Am J Physiol Cell Physiol. 2014. PMID: 24336649 Free PMC article.
-
Menthol Binding to the Human α4β2 Nicotinic Acetylcholine Receptor Facilitated by Its Strong Partitioning in the Membrane.J Phys Chem B. 2020 Mar 12;124(10):1866-1880. doi: 10.1021/acs.jpcb.9b10092. Epub 2020 Mar 2. J Phys Chem B. 2020. PMID: 32048843 Free PMC article.
-
Dual role of nicotine in addiction and cognition: a review of neuroimaging studies in humans.Neuropharmacology. 2014 Sep;84:111-22. doi: 10.1016/j.neuropharm.2013.02.015. Epub 2013 Mar 6. Neuropharmacology. 2014. PMID: 23474015 Free PMC article. Review.
-
Nicotine-related beliefs induce dose-dependent responses in the human brain.Nat Ment Health. 2024 Feb;2(2):177-188. doi: 10.1038/s44220-023-00188-9. Epub 2024 Jan 3. Nat Ment Health. 2024. PMID: 39463822 Free PMC article.
-
Density of α4β2* nAChR on the surface of neurons is modulated by chronic antagonist exposure.Pharmacol Res Perspect. 2015 Mar;3(2):e00111. doi: 10.1002/prp2.111. Pharmacol Res Perspect. 2015. PMID: 25729578 Free PMC article.
References
-
- Fellows JL, Trosclair A, Adams EK, Rivera CC. Annual smoking-attributable mortality, years of potential life lost, and economic costs: United States, 1995–1999. MMWR Morb Mortal Wkly Rep. 2002;51:300–303. - PubMed
-
- Mackay J, Eriksen M, Shafey O. The Tobacco Atlas. 2nd. Atlanta, GA: American Cancer Society; 2006.
-
- Westman EC, Rose JE. Nicotine replacement therapies and beyond. In: Piasecki M, Newhouse P, editors. Nicotine in Psychiatry. Washington, DC: American Psychiatric Press; 1999. pp. 215–233.
-
- Xiao Y, Baydyuk M, Wang HP, Davis HE, Kellar KJ. Pharmacology of the agonist binding sites of rat neuronal nicotinic receptor subtypes expressed in HEK 293 cells. Bioorg Med Chem Lett. 2004;14:1845–1848. - PubMed
-
- Breese CR, Marks MJ, Logel J, et al. Effect of smoking history on [3H]nicotine binding in human postmortem brain. J Pharmacol Exp Ther. 1997;282:7–13. - PubMed
Publication types
MeSH terms
Substances
Grants and funding
LinkOut - more resources
Full Text Sources