

Combined assessment of metabolic and volumetric changes for assessment of tumor response in patients with soft-tissue sarcomas
- PMID: 18794268
- PMCID: PMC4068272
- DOI: 10.2967/jnumed.108.053694
Combined assessment of metabolic and volumetric changes for assessment of tumor response in patients with soft-tissue sarcomas
Abstract
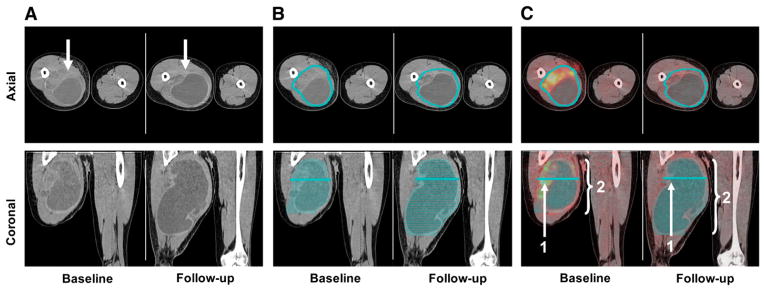
By allowing simultaneous measurements of tumor volume and metabolic activity, integrated PET/CT opens up new approaches for assessing tumor response to therapy. The aim of this study was to determine whether combined assessment of tumor volume and metabolic activity improves the accuracy of (18)F-FDG PET for predicting histopathologic tumor response in patients with soft-tissue sarcomas.
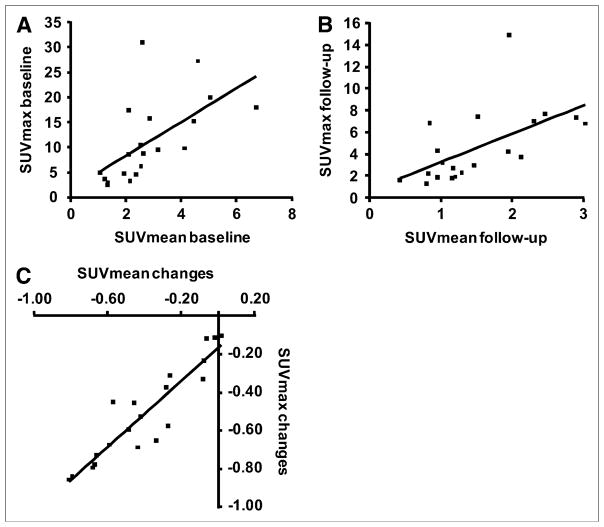
Methods: Twenty patients with locally advanced high-grade soft-tissue sarcoma (10 men and 10 women; mean age, 49 +/- 17 y) were studied by (18)F-FDG PET/CT before and after preoperative therapy. CT tumor volume (CTvol) was measured by delineating tumor borders on consecutive slices of the CT scan. Mean and maximum (18)F-FDG standardized uptake value within this volume (SUVmean and SUVmax, respectively) were determined. Two indices of total lesion glycolysis (TLG) were calculated by multiplying tumor volume by SUVmean (TLGmean) and SUVmax (TLGmax). Changes in CTvol, SUVmean, SUVmax, TLGmean, and TLGmax after chemotherapy were correlated with histopathologic tumor response (> or =95% treatment-induced tumor necrosis). Accuracy for predicting histopathologic response was compared by receiver-operating-characteristic (ROC) curve analysis.
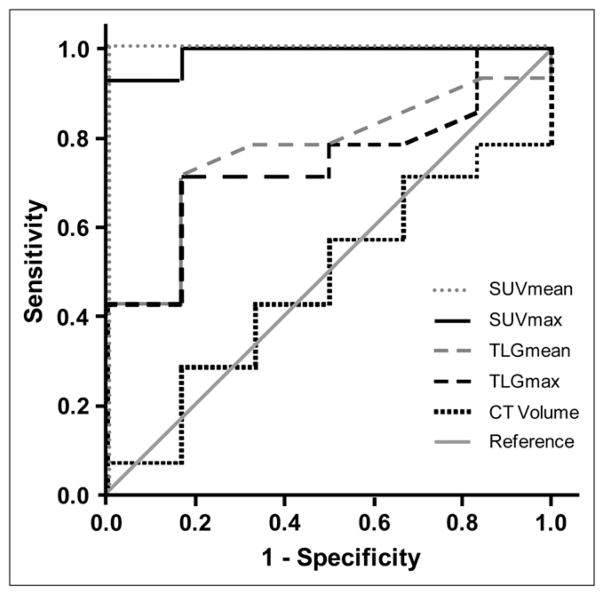
Results: Baseline SUVmax, SUVmean, CTvol, TLGmean, and TLGmax were 11.22 g/mL, 2.84 g/mL, 544.1 mL, 1,619.8 g, and 8852.9 g, respectively. After neoadjuvant therapy, all parameters except CTvol showed a significant decline (DeltaSUVmax = -51%, P < 0.001; DeltaSUVmean = -40%, P < 0.001; DeltaCTvol = -14%, P = 0.37; DeltaTLGmean = -44%, P = 0.006; and DeltaTLGmax = -54%, P = 0.001). SUV changes in histopathologic responders (n = 6) were significantly more pronounced than those in nonresponders (n = 14) (P = 0.001). Histopathologic response was well predicted by changes in SUVmean and SUVmax (area under ROC curve [AUC] = 1.0 and 0.98, respectively) followed by TLGmean (AUC = 0.77) and TLGmax (AUC = 0.74). In contrast, changes in CTvol did not allow prediction of treatment response (AUC = 0.48).
Conclusion: In this population of patients with sarcoma, TLG was less accurate in predicting tumor response than were measurements of the intratumoral (18)F-FDG concentration (SUVmax, SUVmean). Further evaluation of TLG in larger patient populations and other tumor types is necessary to determine the value of this conceptually attractive parameter for assessing tumor response.
Figures

References
-
- Larson SM, Erdi Y, Akhurst T, et al. Tumor treatment response based on visual and quantitative changes in global tumor glycolysis using PET-FDG imaging: the visual response score and the change in total lesion glycolysis. Clin Positron Imaging. 1999;2:159–171. - PubMed
-
- Beyer T, Townsend DW, Brun T, et al. A combined PET/CT scanner for clinical oncology. J Nucl Med. 2000;41:1369–1379. - PubMed
-
- Pottgen C, Levegrun S, Theegarten D, et al. Value of 18F-fluoro-2-deoxy-D-glucose-positron emission tomography/computed tomography in non-small-cell lung cancer for prediction of pathologic response and times to relapse after neoadjuvant chemoradiotherapy. Clin Cancer Res. 2006;12:97–106. - PubMed
-
- Schelling M, Avril N, Nahrig J, et al. Positron emission tomography using [18F]fluorodeoxyglucose for monitoring primary chemotherapy in breast cancer. J Clin Oncol. 2000;18:1689–1695. - PubMed
-
- Eschmann SM, Friedel G, Paulsen F, et al. 18F-FDG PET for assessment of therapy response and preoperative re-evaluation after neoadjuvant radio-chemotherapy in stage III non-small cell lung cancer. Eur J Nucl Med Mol Imaging. 2007;34:463–471. - PubMed
MeSH terms
Substances
Grants and funding
LinkOut - more resources
Full Text Sources
Medical