. 2008 Sep 22;182(6):1153-69.
doi: 10.1083/jcb.200712022. Epub 2008 Sep 15.

Regulation of caveolin-1 membrane trafficking by the Na/K-ATPase

Affiliations

Regulation of caveolin-1 membrane trafficking by the Na/K-ATPase

Ting Cai et al. J Cell Biol. .

Abstract

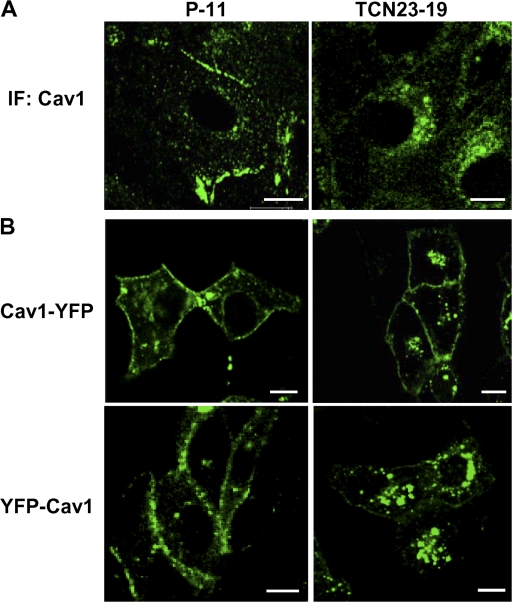
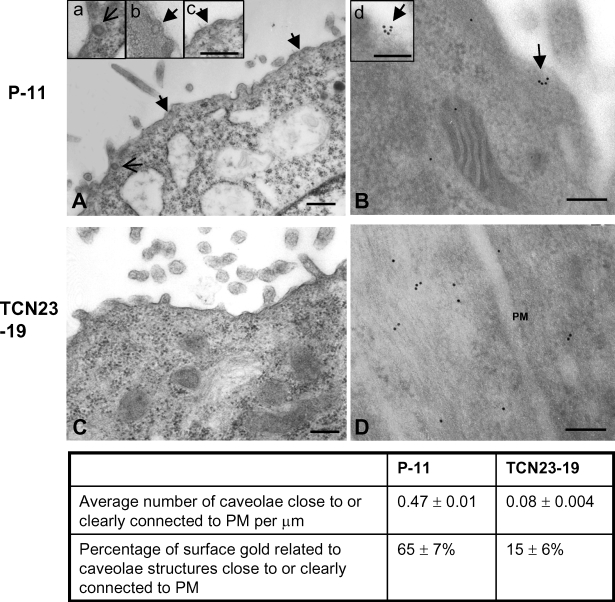
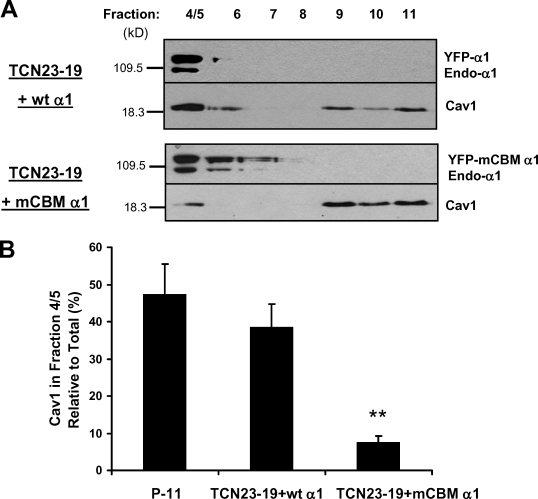
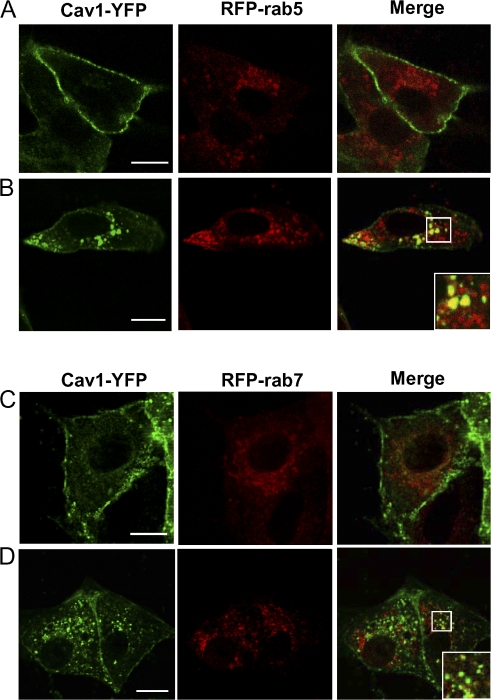
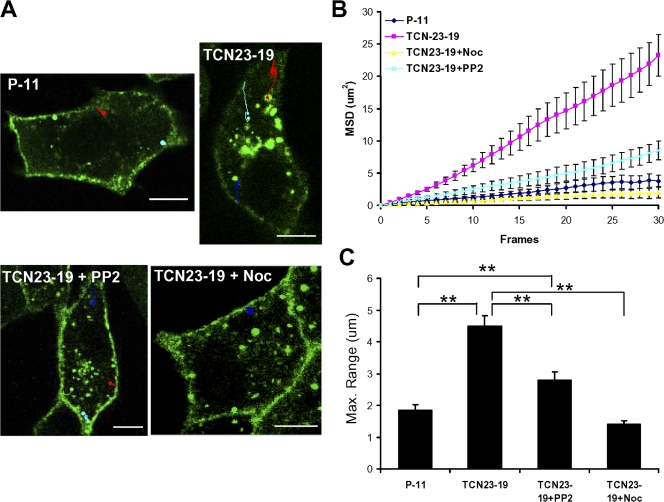
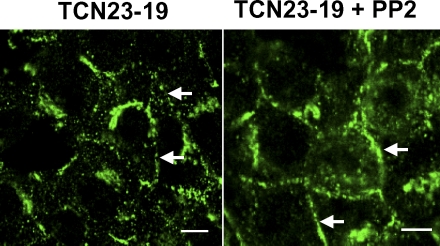
Here, we show that the Na/K-ATPase interacts with caveolin-1 (Cav1) and regulates Cav1 trafficking. Graded knockdown of Na/K-ATPase decreases the plasma membrane pool of Cav1, which results in a significant reduction in the number of caveolae on the cell surface. These effects are independent of the pumping function of Na/K-ATPase, and instead depend on interaction between Na/K-ATPase and Cav1 mediated by an N-terminal caveolin-binding motif within the ATPase alpha1 subunit. Moreover, knockdown of the Na/K-ATPase increases basal levels of active Src and stimulates endocytosis of Cav1 from the plasma membrane. Microtubule-dependent long-range directional trafficking in Na/K-ATPase-depleted cells results in perinuclear accumulation of Cav1-positive vesicles. Finally, Na/K-ATPase knockdown has no effect on processing or exit of Cav1 from the Golgi. Thus, the Na/K-ATPase regulates Cav1 endocytic trafficking and stabilizes the Cav1 plasma membrane pool.


Figures

Figure 1.
Figure 1.
Na/K-ATPase knockdown changes subcellular distribution of Cav1. (A) A representative Western blot shows the amount of α1 in total cell lysates from different cell lines. (B) Total cell homogenate from control (P-11) and knockdown (A4-11 and TCN23-19) cells was fractionated by gradient centrifugation as described under Materials and methods. Fractions (1 ml each) were collected from top to bottom, and equal volume of each fraction was immunoblotted for proteins as indicated. (C) Distribution of different subcellular markers in different fractions: EEA-1 (early endosomes), GM130 (Golgi), Calnexin (ER). A representative blot from P-11 cells is shown. Similar distribution of these markers was detected in the knockdown cells. (D) Cav1 in total cell lysates and fraction 4/5 was analyzed by Western blot. Quantitative data (mean ± SE) from 4–6 independent experiments are shown, **, P < 0.01 in comparison to control.
Figure 2.
Figure 2.
Effects of Na/K-ATPase knockdown on cellular distribution of Cav1. (A) P-11 and TCN23-19 cells were fixed, permeabilized, and stained for total cellular Cav1. (B) Cells were transfected with either YFP-Cav1 or Cav1-YFP and analyzed after 24 h. Representative images of five independent experiments are shown. Bar, 5 μm.
Figure 3.
Figure 3.
Effects of Na/K-ATPase knockdown on caveolae formation. Control or Na/K-ATPase knockdown cells were fixed and embedded, and ultrathin sections were analyzed by electron microscopy. Left: caveolae (A and insets b and c) were detected in the control cells as pointed by solid arrow, but rarely seen in the knockdown cells (C). Right: immuno-EM was performed to examine the localization of Cav1. Surface clusters of gold particles were detected in P-11 (B and inset d), but rarely seen in TCN23-19 cells (D). The number of caveolae or gold particles in each cell line was determined in images randomly acquired at the same magnification. Quantitative data were obtained by double-blind analysis in over 40 cells from each cell line, and listed in the table. A coated pit is pointed by an open arrow in A and inset “a”. Representative images are shown. Bar, 200 nm.
Figure 4.
Figure 4.
FRET analyses of the interaction between Cav1 and Na/K-ATPase α1 subunit. YFP- tagged α1, D371N, or mCBM was transfected together with CFP-Cav1 into TCN23-19 cells. FRET analyses were done as described in Materials and methods. YFP-only and CFP-Cav1–transfected cells were used as a negative control. (A) Images were taken before and after photobleaching. The ROI_1 was bleached at 515 nm with full power. Small regions of plasma membrane in (ROI_2) and out (ROI_3) of the bleached area were selected for measurement, and FRET efficiency was calculated from the measurements using the equation as shown in the table. Bar, 2 μm. (B) Corrected FRET efficiency was calculated from each experiment and values are mean ± SE of 4–5 independent experiments. *, P < 0.05 in comparison to control.
Figure 5.
Figure 5.
Knocking-in a wild-type, but not mCBM α1 mutant rescues Cav1 distribution in TCN23-19 cells. TCN23-19 cells were rescued by YFP-tagged wild-type α1 (wt α1) or mCBM. Stable cell lines were generated and analyzed as described in Fig. 1. (A) A set of representative Western blots from four independent experiments showing the expression of both YFP-α1/mCBM α1 (140 kD) and residual endogenous α1 (110 kD), and the distribution of Cav1 in each fraction. (B) Combined data from four different experiments shows that expression of wild-type rat α1, but not the mCBM α1, restored the distribution of Cav1 into the 4/5 fraction in TCN23-19 cells . **, P < 0.01 in comparison with control P-11. Endo α1: endogenous α1.
Figure 6.
Figure 6.
Expression of wild-type rat α1 and D371N, but not mCBM, in TCN23-19 cells restored Cav1 distribution. Cells were cotransfected with caveolin-CFP and YFP-tagged wild-type rat α1 (α1 wt), D371N, or mCBM. Images were taken by confocal microscope, and pseudo-color was assigned to the images to show colocalization. Red arrowhead: rescued cells; blue arrowhead: cells that were not rescued by either rat α1 or its mutants. A set of representative images of three separate experiments is shown. Bar, 5 μm.
Figure 7.
Figure 7.
Analyses of the Golgi pool of Cav1. (A) P-11 and (B) TCN23-19 cells were transfected with Cav1-YFP. After 24 h, cells were fixed and stained for giantin and imaged. (C) P-11 and (D) TCN23-19 cells were immunostained for endogenous Cav1 and giantin. The white square area was enlarged and showed at the top right corner of the merged image to display the colocalization of giantin with Cav1. (E) P-11 and TCN23-19 cells were extracted by cold 0.1% Triton X-100 for 2 min as described in Materials and methods. Both soluble and insoluble fractions were collected and subjected to Western blot detection of α1 and Cav1. A representative blot of three independent experiments is shown. (F) P-11(a and b) and TCN23-19 (c and d) cells were transfected with Cav1-YFP for 3 h, then cells were fixed and stained for giantin (a and c). In b and d, transfected cells were treated with 10 μg/ml cycloheximide (Chx) for 3 h, then stained for giantin. Similar experiments were repeated at least four times. Images were taken by confocal microscope. Bars stand for 5 μm in all images.
Figure 8.
Figure 8.
Colocalization of Cav1-YFP with RFP-rab5, but not RFP-rab7, in Na/K-ATPase knockdown cells. Both control P-11 (A and C) and knockdown TCN23-19 (B and D) cells were cotransfected with Cav1-YFP and RFP-rab5 or RFP-rab7 as indicated. Images were taken after 24 h of transfection. A clear colocalization of Cav1 with Rab5, but not Rab7, was seen in knockdown cells. Bar, 10 μm.
Figure 9.
Figure 9.
Effects of Na/K-ATPase knockdown on the mobility of Cav1-YFP–positive vesicles. Control (P-11) and knockdown (TCN23-19) cells were transfected with Cav1-YFP, and Cav1-YFP–positive vesicles moving underneath or away from the plasma membrane were monitored using time-lapse confocal microscopy. (A) Trajectories of the moving Cav1-YFP–positive vesicles in control, knockdown cells, as well as in the knockdown cells that were treated with 5 μM of nocodazole (Noc) or 2 μM of PP2. The moving path of each moving vesicle was shown as a line and ended with a dot. The images are the overlay of the trajectory with the synergized snapshots from Videos 1, 3, 5, and 7. (B) The mean square distance (MSD) each Cav1-YFP–positive vesicle traveled between each frame was measured, and the mean ± SE from at least 30 measurements is shown in the graph. (C) The average of maximal range of each vesicle traveled was calculated and shown in the bar graph. Values are mean ± SE of 16 separate experiments of each cell line. **, P < 0.01 between groups as indicated. Bar, 10 μm.
Figure 10.
Figure 10.
Effect of Src inhibitor PP2 on the cellular distribution of Cav1. TCN23-19 cells were treated with 2 μM of PP2 for 5 h; afterward, both control and PP2-treated cells were stained for Cav1. The plasma membrane signals were labeled by solid arrows in both treated and untreated cells to illustrate the recovery of Cav1 signal in the plasma membrane of PP2-treated cells. A set of representative images from three experiments is shown. Bar, 5 μm.

Similar articles

Cited by

References

    1. Aizman, O., P. Uhlen, M. Lal, H. Brismar, and A. Aperia. 2001. Ouabain, a steroid hormone that signals with slow calcium oscillations. Proc. Natl. Acad. Sci. USA. 98:13420–13424. - PMC - PubMed
    1. Anderson, R.G. 1998. The caveolae membrane system. Annu. Rev. Biochem. 67:199–225. - PubMed
    1. Baker, P.F., and J.S. Willis. 1969. On the number of sodium pumping sites in cell membranes. Biochim. Biophys. Acta. 183:646–649. - PubMed
    1. Baker, P.F., and J.S. Willis. 1970. Potassium ions and the binding of cardiac glycosides to mammalian cells. Nature. 226:521–523. - PubMed
    1. Balasubramanian, N., D.W. Scott, J.D. Castle, J.E. Casanova, and M.A. Schwartz. 2007. Arf6 and microtubules in adhesion-dependent trafficking of lipid rafts. Nat. Cell Biol. 9:1381–1391. - PMC - PubMed

Publication types

MeSH terms