. 2008 Sep 22;182(6):1127-39.
doi: 10.1083/jcb.200712091. Epub 2008 Sep 15.

Effector caspase Dcp-1 and IAP protein Bruce regulate starvation-induced autophagy during Drosophila melanogaster oogenesis

Affiliations

Effector caspase Dcp-1 and IAP protein Bruce regulate starvation-induced autophagy during Drosophila melanogaster oogenesis

Ying-Chen Claire Hou et al. J Cell Biol. .

Abstract

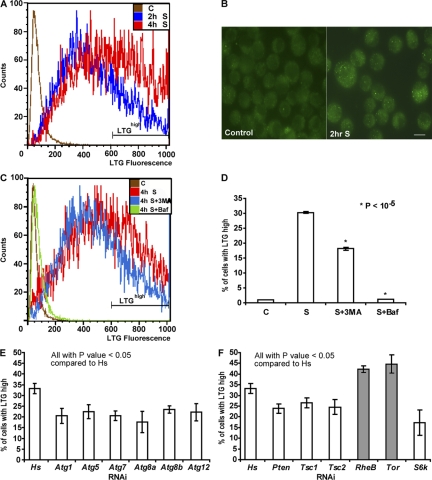
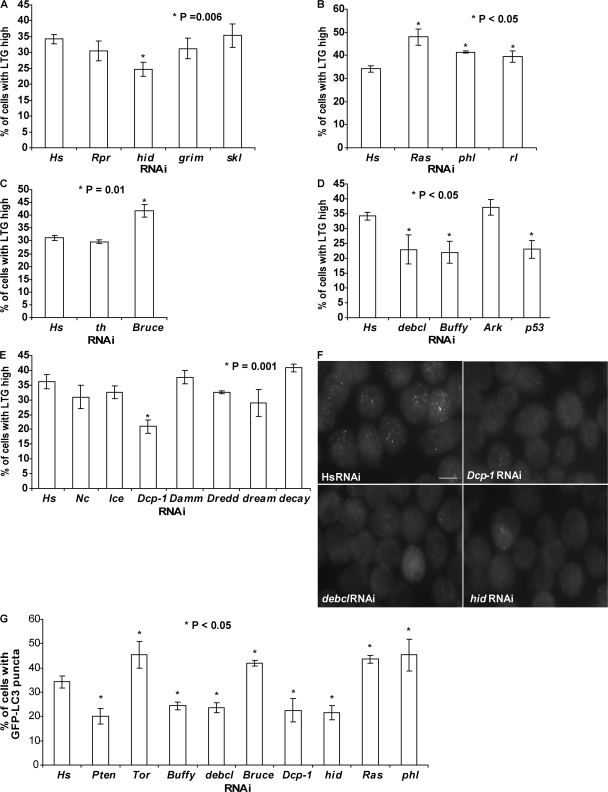
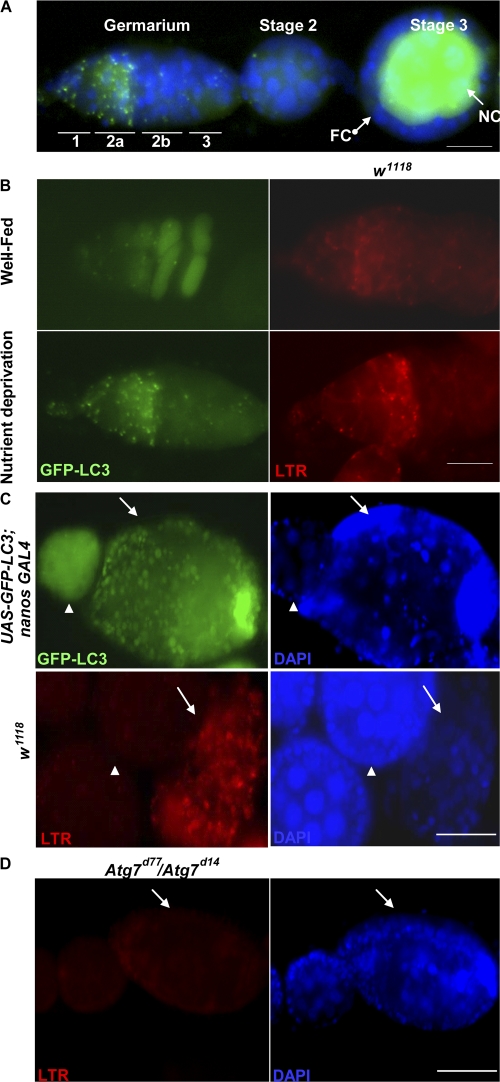
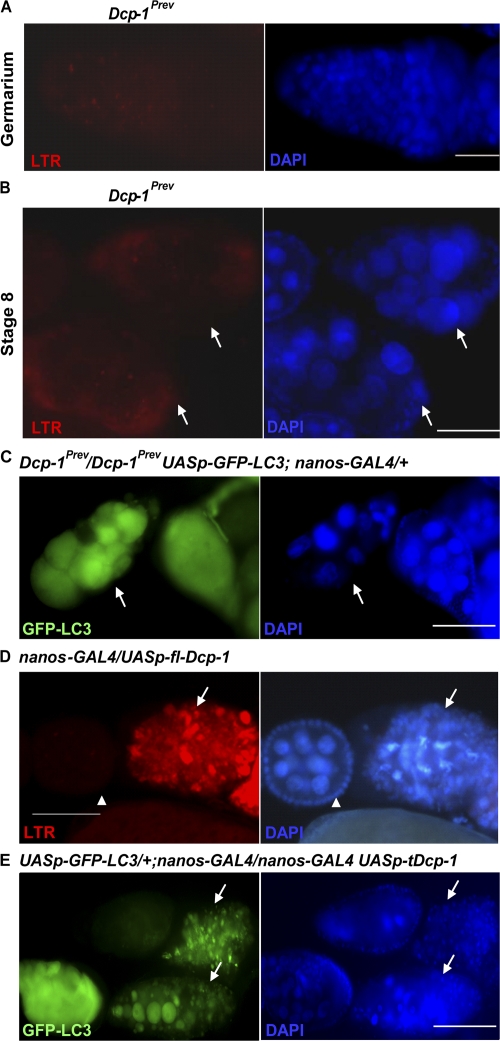
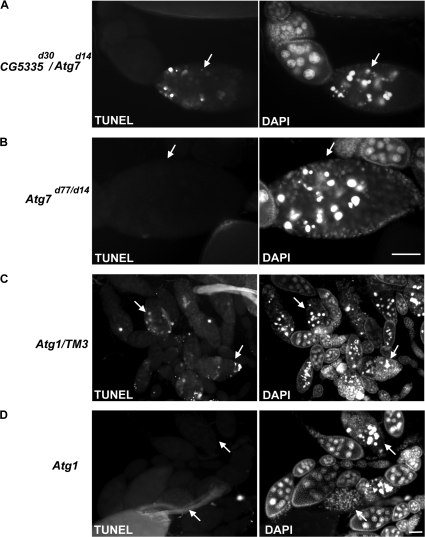
A complex relationship exists between autophagy and apoptosis, but the regulatory mechanisms underlying their interactions are largely unknown. We conducted a systematic study of Drosophila melanogaster cell death-related genes to determine their requirement in the regulation of starvation-induced autophagy. We discovered that six cell death genes--death caspase-1 (Dcp-1), hid, Bruce, Buffy, debcl, and p53-as well as Ras-Raf-mitogen activated protein kinase signaling pathway components had a role in autophagy regulation in D. melanogaster cultured cells. During D. melanogaster oogenesis, we found that autophagy is induced at two nutrient status checkpoints: germarium and mid-oogenesis. At these two stages, the effector caspase Dcp-1 and the inhibitor of apoptosis protein Bruce function to regulate both autophagy and starvation-induced cell death. Mutations in Atg1 and Atg7 resulted in reduced DNA fragmentation in degenerating midstage egg chambers but did not appear to affect nuclear condensation, which indicates that autophagy contributes in part to cell death in the ovary. Our study provides new insights into the molecular mechanisms that coordinately regulate autophagic and apoptotic events in vivo.


Figures

Figure 1.
Figure 1.
Quantification of starvation-induced autophagy in D. melanogaster l(2)mbn cells. (A) Flow cytometry analysis of l(2)mbn cells starved for 2 h (2h S) or 4 h (4h S) showed an increase in LTG fluorescence levels (x axis) compared with control cells in full-nutrient medium (C). The gate shown on the histogram represents the LTGhigh population. (B) Representative images of GFP-LC3 puncta in control and 2-h starved l(2)mbn cells. An increase in GFP-LC3 puncta was observed in the starved cells (left). Bar, 10 μm. (C) Flow cytometry analysis of 4-h starved cells were incubated with 3MA (4h S + 3MA) and Baf (4h S + Baf). Both autophagy inhibitors reduced the LTG fluorescence levels compared with starved cells (4h S). Control cells in nutrient-full medium (C) are represented by the brown line. (D) Both autophagy inhibitors, 3MA and Baf, reduced the LTGhigh population significantly. (3MA, P = 0.00001; and Baf, P = 0.00006). (E) RNAi of representative Atg genes decreased the LTR fluorescence levels compared with control. (Atg1, P = 0.01; Atg5, P = 0.01; Atg7, P = 0.002; Atg8a, P = 0.008; Atg8b, P = 0.006; and Atg12, P = 0.02). (F) RNAi of all tested genes in the TOR–PI3K pathways had a statistically significant effect on LTG fluorescence levels. Known negative regulators of autophagy are shown with gray bars; positive regulators are shown with white bars. (Pten, P = 0.007; Tsc1, P = 0.027; Tsc2, P = 0.025; RheB, P = 0.005; Tor, P = 0.016; and S6k, P = 0.012). dsRNA corresponding to a human gene (Hs) was used as a negative control in E and F. Results represent the mean value ± SD from at least three independent experiments.
Figure 2.
Figure 2.
Identification of known cell death–related genes in autophagy regulation in l(2)mbn cells using RNAi. (A) The percentage of LTGhigh cells was reduced by hid-RNAi (P = 0.006) but not by rpr, grim, and skl-RNAi. (B) Knockdown of Ras, phl, and rl expression by RNAi resulted in an increase in the percentage of LTGhigh cells. (Ras, P = 0.003; phl, P = 0.001; and rl, P = 0.028). (C) th-RNAi treatment (24 h) had no significant effect on LTG levels; in contrast, RNAi of Bruce resulted in an increase in LTG fluorescence levels (P = 0.01). (D) Reduction of debcl, Buffy, or p53 expression by RNAi resulted in a decrease in LTG fluorescence levels. (debcl, P = 0.018; Buffy, P = 0.006; and p53, P = 0.004). (E) RNAi of effector caspase Dcp-1 resulted in a significant decrease in the LTGhigh population (P = 0.001). (F) Representative images of GFP-LC3 puncta in cells treated with the indicated RNAi after a 2-h starvation treatment. Bar, 10 μm. (G) Quantification of cells with GFP-LC3 puncta after RNAi treatment. Cells with more than three GFP-LC3 punctate dots were considered to be GFP-LC3–positive cells. Cells treated with the RNAi indicated here all showed a significant difference (P < 0.05) in the percentage of GFP-LC3–positive cells compared with the human (Hs) RNAi control. (Pten, P = 0.006; Tor, P = 0.034; Buffy, P = 0.005; debcl, P = 0.003; Bruce, P = 0.003; Dcp-1, P = 0.007; hid, P = 0.002; Ras, P = 0.006; and phl, P = 0.050). Results represent the mean value ± SD from three independent experiments.
Figure 3.
Figure 3.
Nutrient deprivation induces autophagy at region 2 within the germarium and in dying midstage egg chambers. (A) GFP-LC3 proteins were expressed in nurse cells (NC) but not in follicle cells (FC) by using the UASp/nanos Gal4 system. DAPI staining of nuclei is shown in blue. (B) UASp-GFP-LC3; nanos GAL4 flies were conditioned on yeast paste and had a diffuse GFP-LC3 pattern. Numerous GFP-LC3 puncta (green) at region 2 within germarium were observed in nutrient-deprived flies. Ovaries were stained with LTR in w1118 flies. Germarium of nutrient-deprived w1118 flies had an increase in punctate LTR staining (red) compared with well-fed germarium. (C) Degenerating stage 8 egg chambers (arrows) had numerous GFP-LC3 puncta (green) and an increase in LTR-positive dots (red) compared with healthy egg chambers (arrowheads). DAPI (blue) staining of nuclei is shown in the two panels on the right. (D) Degenerating stage 8 egg chambers (arrows) of nutrient-deprived Atg7 mutants (Atg7d77/Atg7d14) showed a dramatic decrease in LTR staining. DAPI staining of nuclei is shown in blue. Bars: (A and B) 20 μm; (C and D) 50 μm.
Figure 4.
Figure 4.
The effector caspase Dcp-1 is not only required for nutrient starvation–induced autophagy but is also sufficient for the induction of autophagy during D. melanogaster oogenesis. (A) Germaria of the nutrient-deprived Dcp-1Prev flies showed a dramatic decrease in LTR staining compared with nutrient-deprived wild-type flies shown in Fig. 3 B. DAPI staining of nuclei is shown in blue. (B) Degenerating stage 8 egg chambers (arrows) of nutrient-deprived Dcp-1Prev flies showed a dramatic decrease in LTR staining compared with nutrient-deprived wild-type flies shown in Fig. 3 C. (C) Lack of Dcp-1 function (UASp-GFP-LC3 Dcp-1Prev/Dcp-1Prev; nanos-GAL4/+) resulted in uniform diffuse staining of GFP-LC3 rather than the punctate pattern observed in wild-type degenerating stage 8 egg chambers shown in Fig 3 C. (D) Dying egg chambers (arrows) of NGT/+; nanos-GAL4/UASp-fl-Dcp-1 flies that were conditioned on yeast paste showed a significant increase in punctate LTR staining (red) compared with healthy egg chambers (arrowheads). (E) Expression of activated Dcp-1 (a truncated form) and GFP-LC3 in the germ line (UASp-GFP-LC3/+; nanos-GAL4/nanos-GAL4 UASp-tDcp-1) resulted in abundant degenerating stage 8 egg chambers (arrows) with numerous GFP-LC3 puncta (green). DAPI staining of nuclei is shown in blue. Bars: (A) 20 μm; (B–E) 50 μm.
Figure 5.
Figure 5.
Bruce suppresses autophagy at region 2 within germarium and in dying stage 8 egg chambers. (A) The germarium in well-fed BruceE81 flies showed an increase in LTR staining (red) compared with wild-type well-fed flies shown in Fig. 3 B (top right). DAPI staining (white) of nuclei is shown on the right. (B) In well-fed wild-type flies, mid-oogenesis nurse cell death is a rare event. Lack of Bruce function resulted in an increase in dying stage 8 egg chambers (arrows) in ovaries under well-fed conditions, and these degenerating stage 8 egg chambers had numerous LTR (red) punctate dots. DAPI staining (white) is shown on the right. Bars: (A) 20 μm; (B) 50 μm.
Figure 6.
Figure 6.
Dcp-1 is required for nutrient starvation–induced germarium cell death, and the IAP protein Bruce inhibits germarium and mid-oogenesis cell death. (A) Ovaries were stained with TUNEL (green) to detect DNA fragmentation. Clusters of cysts with TUNEL staining were observed in region 2 in nutrient-deprived w1118 files. In Dcp-1Prev flies, fewer TUNEL-positive cysts in region 2 were observed. Under well-fed conditions, numerous TUNEL-positive cysts were observed in BruceE81 flies. DAPI staining of nuclei is shown in white. (B) Numerous degenerating stage 8 egg chambers (arrows) with TUNEL-positive staining (green) were observed in well-fed BruceE81 flies. DAPI staining of nuclei (white) is shown on the right. Bars: (A) 20 μm; (B) 50 μm.
Figure 7.
Figure 7.
Lack of Atg7 or Atg1 function reduces DNA fragmentation during mid-oogenesis cell death. (A) TUNEL-positive staining was observed in dying stage 8 egg chambers (arrows) of starved control flies (CG5335d30/Atg7d14). DAPI staining of nuclei (white) is shown on the right. (B) In nutrient-deprived Atg7 mutants (Atg7d77/Atg7d14), degenerating stage 8 egg chambers (arrows) showed no or low levels of TUNEL staining. Nuclear DNA condensation, detected by DAPI, was still observed. (C) Dying stage 8 egg chambers (arrows) from nutrient-deprived control siblings (Atg1Δ3D/TM3) generated from the same cross in D had abundant TUNEL-positive staining. (D) In nutrient-deprived Atg1 GLCs, degenerating stage 8 egg chambers (arrows) showed no or low levels of TUNEL staining. Nuclear DNA condensation (DAPI, right) in degenerating egg chambers appeared to occur as in the controls. Bars, 50 μm.

Similar articles

Cited by

References

    1. Arama, E., J. Agapite, and H. Steller. 2003. Caspase activity and a specific cytochrome C are required for sperm differentiation in Drosophila. Dev. Cell. 4:687–697. - PubMed
    1. Baum, J.S., E. Arama, H. Steller, and K. McCall. 2007. The Drosophila caspases Strica and Dronc function redundantly in programmed cell death during oogenesis. Cell Death Differ. 14:1508–1517. - PubMed
    1. Bergmann, A., J. Agapite, K. McCall, and H. Steller. 1998. The Drosophila gene hid is a direct molecular target of Ras-dependent survival signaling. Cell. 95:331–341. - PubMed
    1. Berry, D.L., and E.H. Baehrecke. 2007. Growth arrest and autophagy are required for salivary gland cell degradation in Drosophila. Cell. 131:1137–1148. - PMC - PubMed
    1. Boya, P., R.A. Gonzalez-Polo, N. Casares, J.L. Perfettini, P. Dessen, N. Larochette, D. Metivier, D. Meley, S. Souquere, T. Yoshimori, et al. 2005. Inhibition of macroautophagy triggers apoptosis. Mol. Cell. Biol. 25:1025–1040. - PMC - PubMed

Publication types

MeSH terms