. 2008 Sep 15;22(18):2485-95.
doi: 10.1101/gad.1685008.

Tuberous sclerosis complex proteins control axon formation

Affiliations

Tuberous sclerosis complex proteins control axon formation

Yong-Jin Choi et al. Genes Dev. .

Abstract

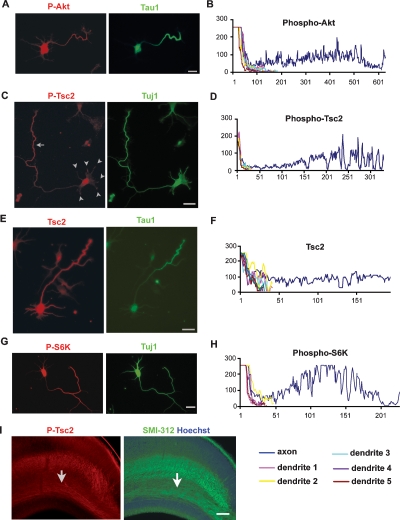
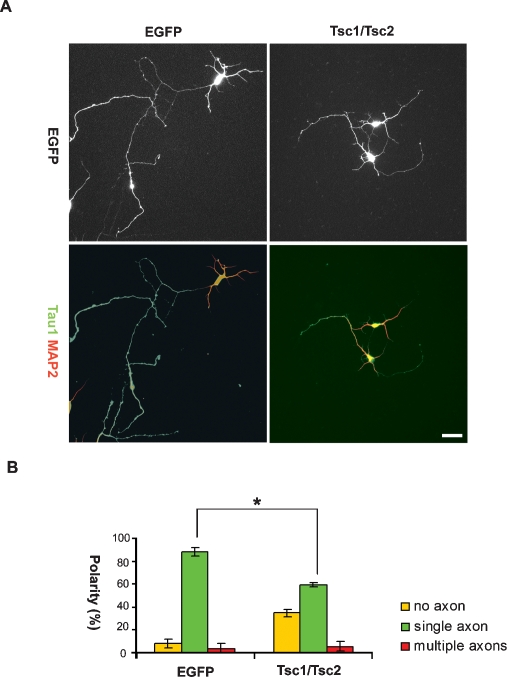
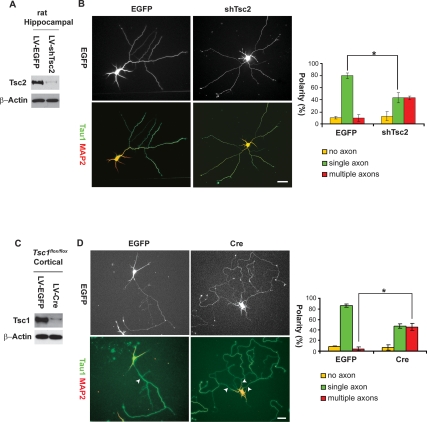
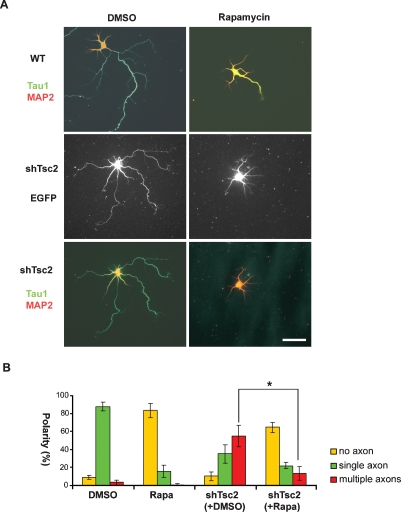
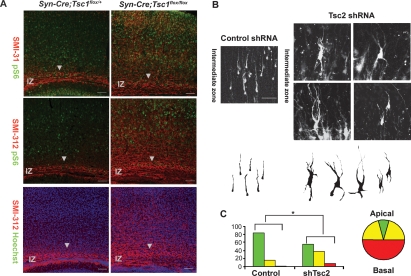
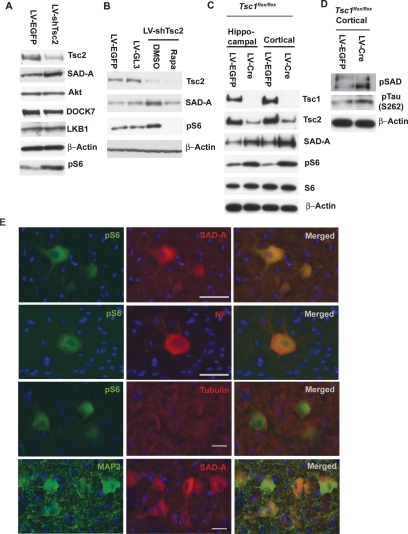
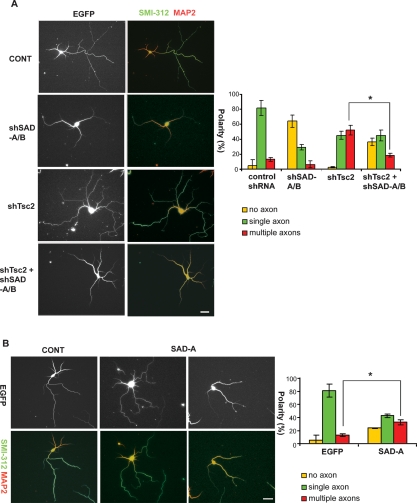
Axon formation is fundamental for brain development and function. TSC1 and TSC2 are two genes, mutations in which cause tuberous sclerosis complex (TSC), a disease characterized by tumor predisposition and neurological abnormalities including epilepsy, mental retardation, and autism. Here we show that Tsc1 and Tsc2 have critical functions in mammalian axon formation and growth. Overexpression of Tsc1/Tsc2 suppresses axon formation, whereas a lack of Tsc1 or Tsc2 function induces ectopic axons in vitro and in the mouse brain. Tsc2 is phosphorylated and inhibited in the axon but not dendrites. Inactivation of Tsc1/Tsc2 promotes axonal growth, at least in part, via up-regulation of neuronal polarity SAD kinase, which is also elevated in cortical tubers of a TSC patient. Our results reveal key roles of TSC1/TSC2 in neuronal polarity, suggest a common pathway regulating polarization/growth in neurons and cell size in other tissues, and have implications for the understanding of the pathogenesis of TSC and associated neurological disorders and for axonal regeneration.


Figures

Figure 1.
Figure 1.
Polarized activation/inactivation of Tsc pathway components in the axon versus dendrites. Axon-specific localization of active (phosphorylated) Akt, inactive (phosphorylated) Tsc2 and active (phosphorylated) S6K (A,C,G) and the profiles of their fluorescence intensity (B,D,H) in the axon and dendrites of stage 3 hippocampal neurons. Fixed neurons were costained with Tau1 (axon-specific marker) or Tuj1 (labeling both axon and dendrites). Each immunostaining was performed in at least four independent experiments, and the images shown are representative of more than 50 neurons examined. (A,B) Phospho-Akt (S473) signal is enriched in the axon. (C,D) Phospho-Tsc2 (T1462) signal is only detected in the axon (arrow), but not in dendrites (arrowheads). (E,F) The level of Tsc2 is approximately the same in the axon and in dendrites. (G,H) Phospho-S6K (T389) is enriched in the axon compared with the shorter dendrites. Bars, 10 μm. (I) Phospho-Tsc2 staining is indistinguishable from axonal marker SMI-312 in the E19 cortical slice. Arrow indicates the main axon tracks positive for phospho-Tsc2. Bar, 100 μm.
Figure 2.
Figure 2.
Tsc overexpression suppresses axon specification/growth in culture. (A,B) Suppression of axon formation by Tsc1 plus Tsc2 overexpression. (A) Representative hippocampal neurons transfected with EGFP alone or together with Tsc1/Tsc2. Neurons were fixed at 6DIV and stained with Tau1 (green, axonal marker) and MAP2 (red, dendritic marker). EGFP-expressing control cells show a single axon and multiple dendrites. Tsc1/Tsc2-expressing cells do not have a Tau1-positive process. (B) Neuronal polarity phenotypes were categorized into three groups: no axon (yellow bar), single axon (green bar), and multiple axons (red bar). (*) P < 0.0005 for single axon between the two groups by ANOVA. The data represent the mean ± SD of 74–171 neurons per condition from three independent experiments. Bar, 20 μm.
Figure 3.
Figure 3.
TSC deficiency induces multiple axons in culture. (A–D) Knockdown of Tsc2 by shRNA or knockout of Tsc1 induced multiple axons in vitro. (A) Tsc2 protein level in E18 rat hippocampal neurons infected with a lentivirus expressing control shRNA or shRNA against Tsc2 (shTsc2). (B) E18 rat hippocampal neurons transfected with either EGFP alone or EGFP together with Tsc2 shRNA. Tsc2 knockdown induced multiple axons, all of which are positive for Tau1. (*) P < 0.001 for multiple axons between the two groups by ANOVA. (C) Tsc1 protein level in E17 Tsc1flox/flox mouse hippocampal neurons infected with a control or Cre-expressing lentivirus. Neurons were lysed for Western blot analysis at 6DIV. (D) E17 mouse hippocampal neurons from Tsc1flox/flox embryos transfected with EGFP alone or EGFP together with Cre. Arrowheads indicate axons positive for Tau1. (*) P < 0.001 for multiple axons between the two groups by ANOVA. The data represent the mean ± SD of 135–185 neurons per condition from three independent experiments. Bars, 20 μm.
Figure 4.
Figure 4.
mTOR acts downstream from Tsc2 in neuronal polarity. (A) Rapamycin (20 nM) inhibited axon formation/growth in both the wild-type (WT) and the Tsc2-knockdown rat hippocampal neurons. Bar, 20 μm. (B) Quantification of polarity defects. (*) P < 0.01 between multiple axons in shTsc2(+DMSO) and shTsc2(+Rapa) groups by ANOVA. The data represent the mean ± SD of 127–180 neurons per condition from three independent experiments.
Figure 5.
Figure 5.
Ectopic axon formation in Syn-Cre;Tsc1flox/flox mouse cortex and defective neuronal polarization by Tsc2 knockdown in organotypic brain slices. (A) Control (left) and Tsc1−/− (right) cortical sections stained with phospho-S6 (green) and two axonal markers, SMI-31 or SMI-312 (red). Nuclei were stained by Hoechst (blue). In control mice (Syn-cre;Tsc1flox/+), both SMI-31 and SMI-312 staining was concentrated in the axon-rich intermediate zone (IZ, arrowheads), but in Tsc1−/− mutant mice, SMI-31- and SMI-312-positive processes were found throughout the cortex. Bars, 100 μm. (B) EGFP-positive mouse cortical neurons that express a control shRNA or Tsc2 shRNA and undergo radial migration in the intermediate zone. Computer-aided reconstruction/tracing of these neurons is shown below. E14–E15 mouse embryos were electroporated ex vivo with the shRNA constructs. Organotypic brain slices were cultured for 3 d in vitro. In contrast to the control neurons displaying a thick apical process pointing toward the pia, neurons electroporated with Tsc2 shRNA showed multiple processes oriented toward the lateral or basal direction. Bar, 50 μm. (C) Quantification of polarity defects in migrating cortical neurons in the intermediate zone. Phenotypes were categorized into three groups based on the orientation of the apical process: apical orientation within 15 degrees (green), lateral orientation between 15° and 90° (yellow), and basal orientation with >90° (red). (*) P < 0.0001 by χ2 test. The data represent the mean of 79–83 neurons per condition from three separate experiments.
Figure 6.
Figure 6.
The SAD-A kinase protein level is regulated by Tsc1/Tsc2 in hippocampal and cortical neurons and in cortical tubers of a TSC patient. (A) Rat hippocampal neurons infected with a lentivirus expressing EGFP (LV-EGFP) or an shRNA against Tsc2 (LV-shTsc2). Neurons were lysed at 6DIV for Western blot analysis. Tsc2 knockdown increased the levels of phospho-S6 and the SAD-A protein level. (B) Increase in SAD-A protein level upon Tsc2-knockdown was blocked by rapamycin treatment. Neurons were infected with a control lentivirus (LV-EGFP and LV-GL3, shRNA against luciferase) or LVshTsc2. Cells were treated with either DMSO or rapamycin (20 nM), and lysates were made at 6DIV for Western blot analysis. Note that the basal level of SAD-A protein was not affected by rapamycin. (C) The SAD-A protein level was increased upon deletion of the conditional Tsc1flox/flox alleles in vitro. E17 Tsc1flox/flox hippocampal and cortical neurons were transduced with a lentivirus expressing EGFP or Cre. Note that Tsc1 knockout also markedly reduced the level of Tsc2 protein as reported and increased phospho-S6 (pS6). (D) Deletion of Tsc1flox/flox alleles in cultured neurons resulted in increased levels of phospho-SAD and phospho-Tau (S262). Phospho-SAD was detected using the pSAD(T-al) antibody, which recognizes both phospho-SAD-A and -B. (E) Immunohistochemical analysis of SAD-A expression in human tubers from a TSC patient. Representative images of resected brain sections show colocalization of (green) phospho-S6 (pS6) and (red) SAD-A in the giant cells of the tuber lesion. Positive SAD-A staining was identified in 60% of the pS6-positive giant cells (counted 79/131). The giant cells expressing a high level of SAD-A protein were also positive for neuronal marker MAP2. (Red) Neurofilament staining (NF) confirms increased mTOR activity in the enlarged pS6-positive dysmorphic cells as described (Ozcan et al. 2008). The staining of control protein α-tubulin showed no changes in immunoreactivity in pS6-positive cells. Hoechst dye staining for DNA is shown in blue. Bars, 50 μm.
Figure 7.
Figure 7.
Effects of SAD-A/B knockdown on axon specification/growth in vitro. (A) Rat hippocampal neurons were transfected with control shRNA, SAD-A and SAD-B shRNAs (shSAD-A/B), Tsc2 shRNA (shTsc2), and shTsc2 together with shSAD-A/B, and stained with MAP2 (dendritic marker) and SMI-312 (axonal marker). Knockdown of SAD-A/B blocked the multiple-axon phenotype induced by the Tsc2 shRNA. Quantification is shown on the right. (*) P = 0.001 for multiple axons between the shTsc2 and shTsc2 + shSAD-A/B groups by ANOVA. (B) Effects of SAD-A overexpression on neuronal polarity. Rat hippocampal neurons expressing EGFP alone or expressing EGFP together with SAD-A were fixed at 6DIV. SAD-A overexpression induced multiple axons in some neurons and inhibited axon formation in others. Quantification is shown on the right. (*) P < 0.05 for multiple axons between the two groups by ANOVA. Bars, 20 μm. The data represent the mean ± SD of 123–142 neurons per condition from three independent experiments.

Comment in

Similar articles

Cited by

References

    1. Arimura N., Kaibuchi K. Neuronal polarity: From extracellular signals to intracellular mechanisms. Nat. Rev. Neurosci. 2007;8:194–205. - PubMed
    1. Barnes A.P., Lilley B.N., Pan Y.A., Plummer L.J., Powell A.W., Raines A.N., Sanes J.R., Polleux F. LKB1 and SAD kinases define a pathway required for the polarization of cortical neurons. Cell. 2007;129:549–563. - PubMed
    1. Barnes A.P., Solecki D., Polleux F. New insights into the molecular mechanisms specifying neuronal polarity in vivo. Curr. Opin. Neurobiol. 2008;18:44–52. - PMC - PubMed
    1. Baybis M., Yu J., Lee A., Golden J.A., Weiner H., McKhann G., Aronica E., Crino P.B. mTOR cascade activation distinguishes tubers from focal cortical dysplasia. Ann. Neurol. 2004;56:478–487. - PubMed
    1. Chen Y.M., Wang Q.J., Hu H.S., Yu P.C., Zhu J., Drewes G., Piwnica-Worms H., Luo Z.G. Microtubule affinity-regulating kinase 2 functions downstream of the PAR-3/PAR-6/atypical PKC complex in regulating hippocampal neuronal polarity. Proc. Natl. Acad. Sci. 2006;103:8534–8539. - PMC - PubMed

Publication types