. 2008 Sep 15;22(18):2550-63.
doi: 10.1101/gad.1703108.

Defining the regulatory network of the tissue-specific splicing factors Fox-1 and Fox-2

Affiliations

Defining the regulatory network of the tissue-specific splicing factors Fox-1 and Fox-2

Chaolin Zhang et al. Genes Dev. .

Erratum in

  • Genes Dev. 2008 Oct 15;22(20):2902

Abstract

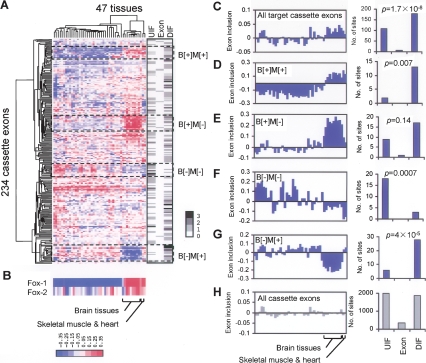
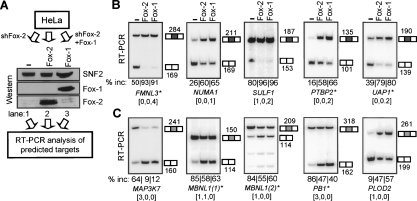
The precise regulation of many alternative splicing (AS) events by specific splicing factors is essential to determine tissue types and developmental stages. However, the molecular basis of tissue-specific AS regulation and the properties of splicing regulatory networks (SRNs) are poorly understood. Here we comprehensively predict the targets of the brain- and muscle-specific splicing factor Fox-1 (A2BP1) and its paralog Fox-2 (RBM9) and systematically define the corresponding SRNs genome-wide. Fox-1/2 are conserved from worm to human, and specifically recognize the RNA element UGCAUG. We integrate Fox-1/2-binding specificity with phylogenetic conservation, splicing microarray data, and additional computational and experimental characterization. We predict thousands of Fox-1/2 targets with conserved binding sites, at a false discovery rate (FDR) of approximately 24%, including many validated experimentally, suggesting a surprisingly extensive SRN. The preferred position of the binding sites differs according to AS pattern, and determines either activation or repression of exon recognition by Fox-1/2. Many predicted targets are important for neuromuscular functions, and have been implicated in several genetic diseases. We also identified instances of binding site creation or loss in different vertebrate lineages and human populations, which likely reflect fine-tuning of gene expression regulation during evolution.


Figures

Figure 1.
Figure 1.
Comparative analysis accurately predicts Fox-1/2 targets. (A, left axis) The number of conserved Fox-1/2-binding sites (blue) and random-motif sites (gray) in UIF (left), exonic (middle), and DIF (right) sequences of cassette exons, using varying thresholds of BLSs. Error bars represent standard error of the mean. (Right axis) The corresponding FDR of prediction is shown in red. The thresholds used in the paper (0.22 for UIF and DIF sites and 0.8 for exonic sites) are indicated by arrowheads. (B) Proportions of different types of splicing patterns for predicted Fox-1/2 targets (left) and all internal exons (right). (C–G) Distribution of conserved Fox-1/2-binding sites in different regions for cassette exons (C), mutually-exclusive exons (D), alternative 5′ splice sites (E), and 3′ splice sites (F), and constitutive exons (G). In each panel, the splicing pattern is shown schematically above the histogram. The distribution of conserved Fox-1/2 sites is color-coded as in B. The distribution of conserved random-motif sites is shown in gray for comparison.
Figure 2.
Figure 2.
Splicing profiling of predicted Fox-1/2 targets shows position-dependent and complex modes of Fox-1/2-mediated splicing regulation. (A) Hierarchical clustering of splicing indices of 234 cassette exons predicted as Fox-1/2 targets in 47 human tissues and cell lines (for color scale, see bottom of B). The tissue cluster on the right includes brain, heart, and skeletal muscle tissues is labeled. For each exon, the number of conserved Fox-1/2-binding sites in UIF, exonic, and DIF sequences is gray-scale coded on the right, in the same order as in the splicing heatmap (grayscale on the right). Four clusters of exons, with different combinations of splicing levels in brain and heart/muscle, are labeled by dashed boxes. (B) The expression pattern of Fox-1/2 in the same order of tissues as in the splicing heatmap (color scale at the bottom). (C–G) Average splicing profile (left) and distribution of conserved Fox-1/2 sites (right) for all 234 predicted targets (C) and exons belonging to the four clusters (D–G). (H, left) The average splicing profile of all cassette exons on the splicing microarrays as controls. (Right) The distribution of random-motif sites for all cassette exons was used to test the enrichment/depletion of Fox-1/2 sites in different regions for exon subsets in C–G. The P-values from χ2 tests are also indicated in (C–G).
Figure 3.
Figure 3.
RT–PCR analysis of predicted cassette exons shows brain- and/or heart/muscle-specific splicing. Exon inclusion level was measured in six human tissues by radioactive RT–PCR. In each panel, the quantified exon inclusion level and the number of conserved UIF, exonic, and DIF UGCAUG elements are indicated above and below the gene symbol, respectively. The size of each PCR product is also indicated.
Figure 4.
Figure 4.
RT–PCR analysis after stable Fox-1/2 overexpression and knockdown in HeLa cells validates predicted targets. (A) Schematic representation of experimental validation in control or transduced HeLa cells. Control HeLa cells express Fox-2 but not Fox-1. Two other transductant pools without Fox-1/2 expression or with only Fox-1 expression were generated by stable retroviral transduction with an shRNA against Fox-2 (shFox-2), or with a combination of shRNA against Fox-2 and stable transfection of Fox-1 cDNA (shFox-2 + Fox-1). The expression of Fox-1 or Fox-2 was confirmed by Western blotting analysis using antibodies specific for each protein. (Lane 1) HeLa cells with shRNA knockdown of Fox-2. (Lane 2) untreated HeLa cells. (Lane 3) HeLa cells with shRNA knockdown of Fox-2 and stable transduction of Fox-1 cDNA. (B,C) Radioactive RT–PCR analysis of predicted Fox-1/2 targets with downstream intronic binding sites (B), or with only upstream intronic binding sites (C). All examples are cassette exons. For each exon, the gene symbol is shown below, together with the number of conserved Fox-1/2-binding sites in UIF, exonic, and DIF sequences. In each panel, the quantified exon-inclusion level and the number of conserved UIF, exonic, and DIF UGCAUG elements are indicated above and below the gene symbol, respectively. The size of each PCR product is also labeled. For some of the genes, indicated by an asterisk, the splicing pattern in tissues was also measured by RT–PCR, as shown in Figure 3.
Figure 5.
Figure 5.
Fox-1/2-mediated splicing regulation depends on the UGCAUG elements. (A) Schematic representation of the FMNL3 minigene, which has four natural copies of putative Fox-1/2-binding sites (labeled 1–4) in DIF sequences. Different use of stop codons due to AS is also indicated by red circles. The conservation pattern of the region is displayed under the diagram. (B) Splicing of the FMNL3 minigene cassette exon in the wild-type minigene, without or with Fox-1 protein, is shown in lanes 1 and 2, respectively. Lanes 38 show the splicing of the mutant minigenes. Mut12 (lanes 3,4) has mutations in sites 1 and 2, and similarly for Mut34 (lanes 5,6) and Mut 1234 (lanes 7,8). The quantified exon inclusion level is indicated. The expression level of Fox-1 was confirmed by Western blotting, as shown at the bottom. (C) Schematic representation of the PB1 minigene. The conservation pattern of the region is displayed under the diagram. The cassette exon, together with ∼250 nt of UIF and DIF sequences, including three natural putative Fox-1/2-binding sites in the UIF region, were inserted into intron 1 of the human β-globin gene. (D) Splicing of the PB1 minigene. See the legend for B for more details.
Figure 6.
Figure 6.
Creation and loss of Fox-1/2-binding sites reflect potential fine-tuning of gene expression after gene duplication. (A) A 34-nt paralogous cassette exon from PTBP1 (PTB) and PTBP2 (nPTB). For each gene, the conservation pattern of the region is displayed under the diagram. The two downstream conserved putative Fox-1/2-binding sites (D-I, D-II) are labeled. Results of RT–PCR analysis are shown on the right for each exon. For each panel, the quantified exon inclusion level is indicated. (B) A 36-nt cassette exon from MBNL1, MBNL2, and MBNL3, shown similarly as in A. The MBNL1 and MBNL2 exons have two copies of the Fox-1/2-binding site, one in the UIF sequences close to the 3′ splice site (U–I) and the other in the exon (E-II). The MBNL3 exon has an additional site in the UIF sequences (U-III). For each panel, the quantified exon inclusion level is indicated. (C) The presence or absence of Fox-1/2-binding sites in 28 vertebrate species for the sites labeled in A and B. The presence of each site in each species is color-coded and shown under the phylogenetic tree. The BLS for each site is shown on the right. For the PTB exon, site D-I appears to be lost in placental mammals by a T-to-C mutation at the first position, resulting in a CGCAUG element, which is shown in green. For the MBNL3 exon, site U-I is polymorphic in human and overlaps with an A/G SNP (rs3736748) at the fourth position. (D) The allele frequency of the SNP rs3736748 in African Americans (YRI), Europeans (CEU), and Asians (HCB/JPT) was determined according to HapMap data. The A allele (blue) results in an intact Fox-1/2-binding site and the G allele (yellow) results in a disrupted site.

References

    1. The Autism Genome Project Consortium Mapping autism risk loci using genetic linkage and chromosomal rearrangements. Nat. Genet. 2007;39:319–328. - PMC - PubMed
    1. Auweter S.D., Fasan R., Reymond L., Underwood J.G., Black D.L., Pitsch S., Allain F.H.-T. Molecular basis of RNA recognition by the human alternative splicing factor Fox-1. EMBO J. 2006;25:163–173. - PMC - PubMed
    1. Baraniak A.P., Chen J.R., Garcia-Blanco M.A. Fox-2 mediates epithelial cell-specific fibroblast growth factor receptor 2 exon choice. Mol. Cell. Biol. 2006;26:1209–1222. - PMC - PubMed
    1. Bhalla K., Phillips H.A., Crawford J., McKenzie O.L.D., Mulley J.C., Eyre H., Gardner A.E., Kremmidiotis G., Callen D.F. The de novo chromosome 16 translocations of two patients with abnormal phenotypes (mental retardation and epilepsy) disrupt the A2BP1 gene. J. Hum. Genet. 2004;49:308–311. - PubMed
    1. Black D.L. Mechanisms of alternative pre-messenger RNA splicing. Annu. Rev. Biochem. 2003;72:291–336. - PubMed

Publication types

LinkOut - more resources