. 2008 Nov;28(22):6731-45.
doi: 10.1128/MCB.02103-07. Epub 2008 Sep 15.

A novel H19 antisense RNA overexpressed in breast cancer contributes to paternal IGF2 expression

Affiliations

A novel H19 antisense RNA overexpressed in breast cancer contributes to paternal IGF2 expression

Nathalie Berteaux et al. Mol Cell Biol. 2008 Nov.

Abstract

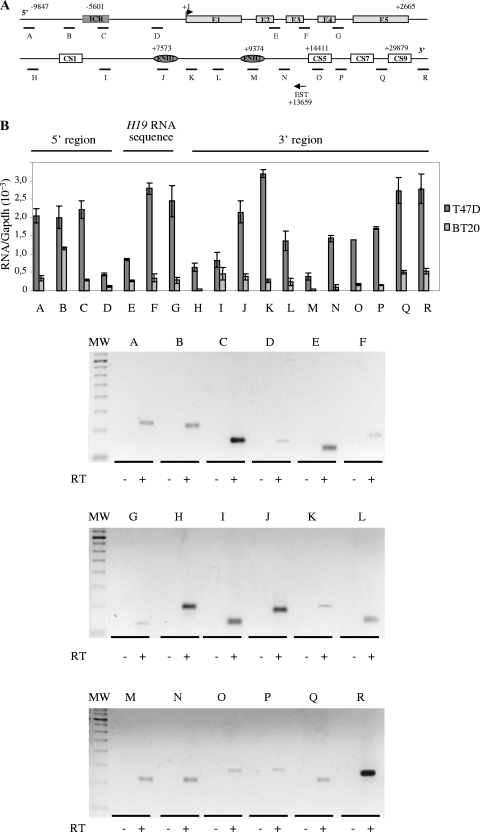
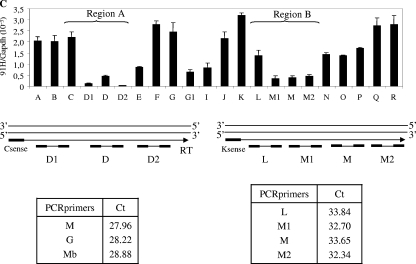
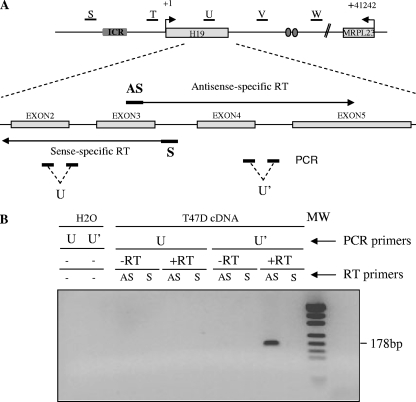
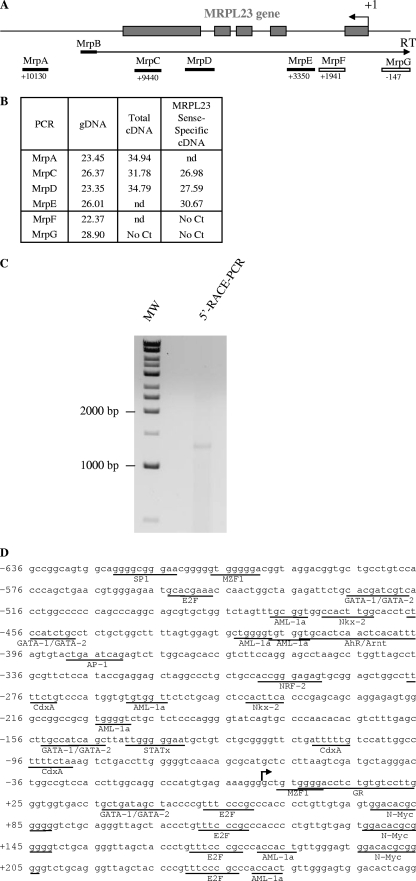
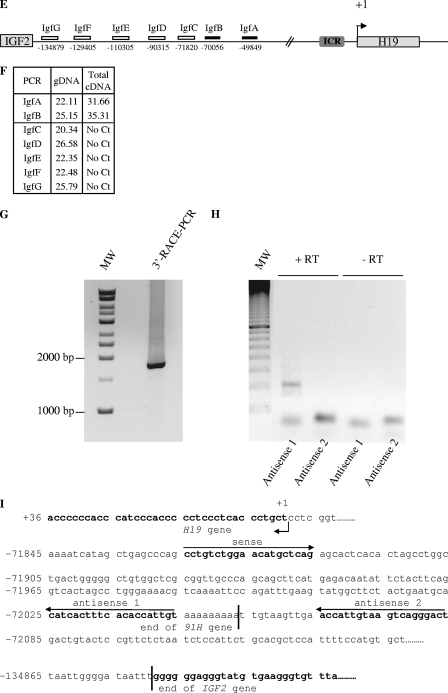
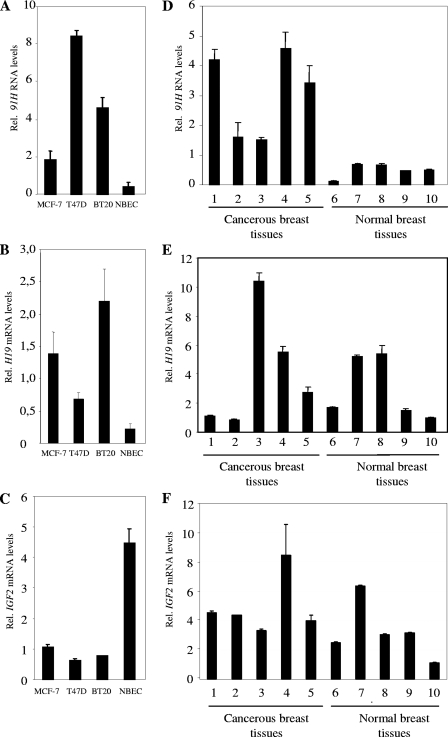
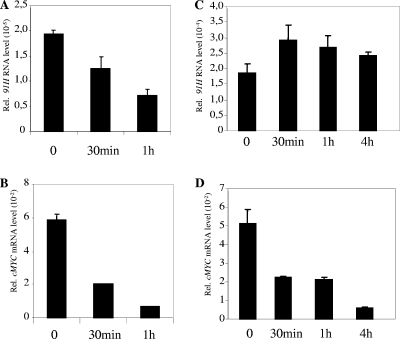
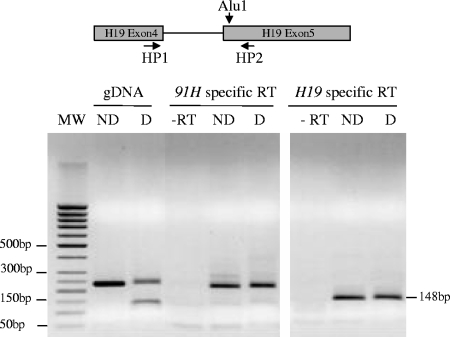
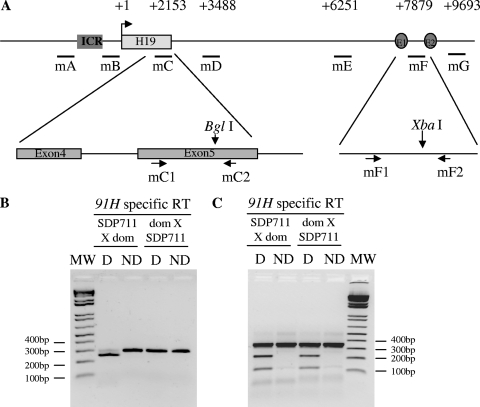
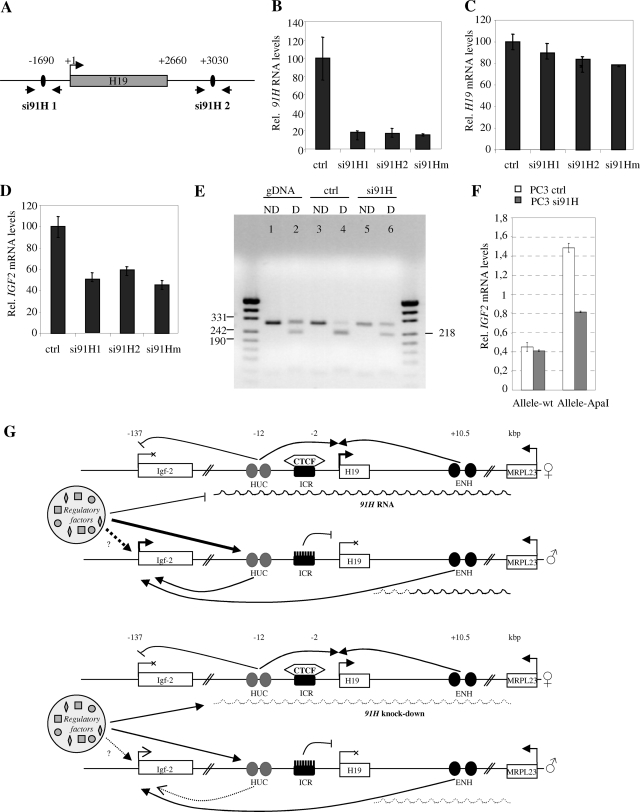
The H19/IGFf2 locus belongs to a large imprinted domain located on human chromosome 11p15.5 (homologue to mouse distal chromosome 7). The H19 gene is expressed from the maternal allele, while IGF2 is paternally expressed. Natural antisense transcripts and intergenic transcription have been involved in many aspects of eukaryotic gene expression, including genomic imprinting and RNA interference. However, apart from the identification of some IGF2 antisense transcripts, few data are available on that topic at the H19/IGF2 locus. We identify here a novel transcriptional activity at both the human and the mouse H19/IGF2 imprinted loci. This activity occurs antisense to the H19 gene and has the potential to produce a single 120-kb transcript that we called the 91H RNA. This nuclear and short-lived RNA is not imprinted in mouse but is expressed predominantly from the maternal allele in both mice and humans within the H19 gene region. Moreover, the transcript is stabilized in breast cancer cells and overexpressed in human breast tumors. Finally, knockdown experiments showed that, in humans, 91H, rather than affecting H19 expression, regulates IGF2 expression in trans.


Figures

FIG. 1.
FIG. 1.
Detection of an intergenic transcriptional activity at the H19 locus in cancer cell lines. (A) Map of the H19 gene locus. The relative positions of the real-time PCR amplification fragments (A to R) are depicted in the map. CS represents conserved regions between mice and humans that possess enhancer activities (17). Black arrow represents a known EST that was identified after alignment of the human chromosome 11 sequence with EST databases. EST, BX 377296 cDNA source placenta. (B) Quantification of RNA levels were determined by real-time RT-PCR on total RNA samples in T47D and BT20 cell lines. The results were normalized to GAPDH expression levels. Agarose gel shows the amplification products obtained after the real-time PCR on T47D cells. Note that amplifications E to G may also potentially quantify H19 precursors RNAs. (C) Strand-specific RT in two regions showing a decrease of 91H transcription (region 1 and region 2). Antisense-specific RT analyses were performed with the primer C sense in region 1 and K sense in region 2. Transcription was detected by PCR using several contiguous primer pairs (D1, D, and D2 for region 1 and L, M1, M, and M2 for region 2). Results, expressed in terms of the cycle threshold (Ct) are indicated in the lower part of panel C. Cycle threshold values that are equivalent for all primer pairs indicate that there is no transcriptional arrest in both tested regions. Primer sequences are available in Table S1 in the supplemental material.
FIG. 1.
FIG. 1.
Detection of an intergenic transcriptional activity at the H19 locus in cancer cell lines. (A) Map of the H19 gene locus. The relative positions of the real-time PCR amplification fragments (A to R) are depicted in the map. CS represents conserved regions between mice and humans that possess enhancer activities (17). Black arrow represents a known EST that was identified after alignment of the human chromosome 11 sequence with EST databases. EST, BX 377296 cDNA source placenta. (B) Quantification of RNA levels were determined by real-time RT-PCR on total RNA samples in T47D and BT20 cell lines. The results were normalized to GAPDH expression levels. Agarose gel shows the amplification products obtained after the real-time PCR on T47D cells. Note that amplifications E to G may also potentially quantify H19 precursors RNAs. (C) Strand-specific RT in two regions showing a decrease of 91H transcription (region 1 and region 2). Antisense-specific RT analyses were performed with the primer C sense in region 1 and K sense in region 2. Transcription was detected by PCR using several contiguous primer pairs (D1, D, and D2 for region 1 and L, M1, M, and M2 for region 2). Results, expressed in terms of the cycle threshold (Ct) are indicated in the lower part of panel C. Cycle threshold values that are equivalent for all primer pairs indicate that there is no transcriptional arrest in both tested regions. Primer sequences are available in Table S1 in the supplemental material.
FIG. 2.
FIG. 2.
Transcriptional orientation of the intergenic transcriptional activity at the H19 locus. (A) Map of the H19 locus. Black lines indicate the five regions (named S to W) where antisense transcription has been established using strand-specific reverse transcription and real-time PCR. Below the map of the H19 locus, the strategy used to analyze transcriptional orientation at the U region is depicted. The same strategy was used to analyze the S, T, V, and W regions. The locations of strand-specific primers used for reverse transcription (primer AS is sense to H19, and primer S is antisense to H19) and PCR amplifications (U and U' amplifications) are indicated. Strand-specific primers were used for reverse transcription on total RNA samples from T47D cells. Real-time PCRs were then performed on each side of the RT priming region to identify the orientation of 91H (U and U' PCR amplifications). (B) Agarose gel of PCR products obtained for the U region with the different RT-PCR combinations. Only RT analyses performed to detect antisense RNA (primer AS) gave significant PCR amplification and only when PCR amplified by the U' primer pair. To exclude any gDNA contaminations, we analyzed RT reactions performed without RT (-RT), and we ascertained the absence of self-priming analyzing reverse transcription performed without any strand-specific primers (H2O). The results obtained for the S, T, V, and W regions can be seen in Fig. S2A in the supplemental material. The primer sequences are available in Table S1 in the supplemental material.
FIG. 3.
FIG. 3.
Determination of the 5′ and 3′ limits of the antisense H19 transcription. (A) Map of the MRPL23 gene region. The relative positions of the PCR amplifications and strand-specific primer used for reverse transcription (MrpB) are indicated. (B) Table indicates cycle thresholds obtained in real-time PCR for each PCR amplifications on total cDNA (random priming of the RT) or after strand-specific reverse transcription with MrpB primer. gDNA is used as a positive amplification control to assess for the amplification efficiency. (C) Determination of the transcription start site of the 91H gene by 5′RACE-PCR. RACE-PCR using T47D cell cDNA and 91H specific primers resulted in the amplification of an ∼1,300-bp DNA fragment. This fragment was cloned into TOPO plasmid for sequencing. (D) Nucleotide sequence of the 5′ region of the 91H transcript. The transcription start site is indicated by a black arrow. Putative transcription factor binding sites identified by computer analysis are underlined. (E) Map of the H19/IGF2 locus. Boxes indicate PCR amplifications used to determine the 3′ limits of the antisense transcription. Successful amplifications are depicted by full boxes, whereas abortive amplifications are shown as open boxes. (F) A table indicates the cycle thresholds (Ct) obtained for each PCR amplification. (G) Determination of the 3′ end of the 91H RNA by 3′RACE-PCR. RACE-PCR using T47D cell cDNA resulted in the amplification of an ∼1,750 bp-DNA fragment. This fragment was cloned into the TOPO plasmid for sequencing. (H) Confirmation of the 3′ end of 91H. RT-PCRs were performed with the primer pairs depicted in panel I: sense plus antisense 1 or sense plus antisense 2. (I) Nucleotide sequence of the 3′ region of the 91H transcript. The H19 and IGF2 genes are indicated in boldface, and the 3′ limit of 91H is pointed out by a black line. Positions relative to the H19 transcription start site (+1) are indicated. Primer sequences can be seen in Table S1 in the supplemental material.
FIG. 3.
FIG. 3.
Determination of the 5′ and 3′ limits of the antisense H19 transcription. (A) Map of the MRPL23 gene region. The relative positions of the PCR amplifications and strand-specific primer used for reverse transcription (MrpB) are indicated. (B) Table indicates cycle thresholds obtained in real-time PCR for each PCR amplifications on total cDNA (random priming of the RT) or after strand-specific reverse transcription with MrpB primer. gDNA is used as a positive amplification control to assess for the amplification efficiency. (C) Determination of the transcription start site of the 91H gene by 5′RACE-PCR. RACE-PCR using T47D cell cDNA and 91H specific primers resulted in the amplification of an ∼1,300-bp DNA fragment. This fragment was cloned into TOPO plasmid for sequencing. (D) Nucleotide sequence of the 5′ region of the 91H transcript. The transcription start site is indicated by a black arrow. Putative transcription factor binding sites identified by computer analysis are underlined. (E) Map of the H19/IGF2 locus. Boxes indicate PCR amplifications used to determine the 3′ limits of the antisense transcription. Successful amplifications are depicted by full boxes, whereas abortive amplifications are shown as open boxes. (F) A table indicates the cycle thresholds (Ct) obtained for each PCR amplification. (G) Determination of the 3′ end of the 91H RNA by 3′RACE-PCR. RACE-PCR using T47D cell cDNA resulted in the amplification of an ∼1,750 bp-DNA fragment. This fragment was cloned into the TOPO plasmid for sequencing. (H) Confirmation of the 3′ end of 91H. RT-PCRs were performed with the primer pairs depicted in panel I: sense plus antisense 1 or sense plus antisense 2. (I) Nucleotide sequence of the 3′ region of the 91H transcript. The H19 and IGF2 genes are indicated in boldface, and the 3′ limit of 91H is pointed out by a black line. Positions relative to the H19 transcription start site (+1) are indicated. Primer sequences can be seen in Table S1 in the supplemental material.
FIG. 4.
FIG. 4.
91H expression is upregulated in breast cancer. (A to C) 91H RNA levels (A), H19 mRNA levels (B), and IGF2 mRNA levels (C) in human breast cells. RNA levels were determined by real-time RT-PCR on total RNA samples from three cancer cell lines (MCF-7, T47D, and BT20) and NBEC. (D to E) 91H RNA levels (D), H19 mRNA levels (E), and IGF2 mRNA levels (F) in human normal and cancer breast tissues. Expressions were normalized on RPLP0 gene expression. H19 RNA sense levels were quantified by using primers designed over exon/exon junctions, and 91H was detected with the H primer pair previously described.
FIG. 5.
FIG. 5.
91H RNA stability in cancer and normal breast cells. Cells were treated with 5 μg of actinomycin D/ml, and RNA levels were determined by real-time RT-PCR at the indicated times. cMYC was used as a positive control for actinomycin D treatment since this mRNA is known to be very unstable. 91H (A) and cMYC (B) RNA levels were determined in NBEC. 91H (C) and cMYC (D) RNA levels were determined in T47D cancer cells.
FIG. 6.
FIG. 6.
Allelic expression analysis of the human 91H RNA. Strand-specific reverse transcription was performed on total RNA from T47D cells with a reverse primer for H19-specific RT and a forward primer for 91H-specific RT (see the Materials and Methods). PCR were performed with primers located on each side of the AluI polymorphic restriction site as indicated in the figure (HP1 and HP2). The PCR products were then digested with AluI and separated into agarose gel. Note that, as expected, the size of the H19 amplification fragment is smaller than those obtained for 91H RNA amplification because of the removal of the 81-bp H19 intron 5 in the H19 RNA. ND, not digested; D, AluI digestion; -RT, amplifications on control reactions made without reverse transcription. gDNA, control amplification on T47D cell gDNA.
FIG. 7.
FIG. 7.
Allelic expression of the murine 91H RNA. (A) Map of H19 region indicating positions of PCR primer pairs used in real-time PCR (mC1 and mC2; mF1 and mF2). (B) RT using a H19-sense-intron 4 primer was performed on total RNA extracted from 5-day-old mouse liver issued from SDP711XM.m.dom. (left panel) or M.m.dom.XSDP711 hybrid mice (right panel). A 301-bp PCR fragment was then obtained by using the mC primer pair and digested (D) or undigested (ND) with BglI at an M. spretus-specific restriction site. (C) Reverse transcription using an mF1 sense primer was performed on the samples described above. A 344-bp PCR fragment was then obtained using the mF primer pair and cut by XbaI at a M. musculus domesticus-specific restriction site.
FIG. 8.
FIG. 8.
91H silencing by RNA interference reduces IGF2 expression on the paternal allele. (A) Map of H19 region indicating the positions of siRNA sequences and the PCR primer pairs used in real-time PCR. T47D cells were transfected with siRNA targeting either the green fluorescent protein (ctrl) or the 91H RNA (si91H 1 and 2 alone or in combination). 91H (B), H19 (C), and IGF2 (D) RNA levels were determined by real-time RT-PCR 24 h after transfection. The results were normalized to RPLP0 expression levels. (E) PC3 cells were transfected with si91H, and the imprinting status of the IGF2 alleles was examined using a RT-PCR amplification digested (D) or undigested (ND) with an ApaI polymorphic restriction site available in this cell line. (F) The IGF2 expression levels were determined on each parental allele using an allele-specific RT-PCR amplification method (51) from PC3 cells transfected with control siRNA or with si91H. (G) Model for 91H trans effect on IGF2 expression. Two sets of enhancers (HUC and ENH sequences) regulate IGF2 expression. Both would be required for full expression of the gene. In addition, the two IGF2 alleles would be competing for a common limited stock of regulatory elements (methylation/acetylation/transcription?). On the maternal allele, 91H would block the locus and prevent the HUC sequences from interaction with any regulatory factors. These would be then directed on the paternal allele, in the HUC region, and/or in the IGF2 promoter region and would cooperate with the cis endodermic enhancers, resulting in IGF2 enhanced expression. Upon siRNA treatment and 91H knockdown, the competition would be lost and, as a consequence, both IGF2 alleles would be now able to interact with the regulatory factors with similar efficiencies. Because these factors are in a limiting amount, a part would be depleted from the paternal IGF2 allele to interact with the maternal allele. This would lead to a paternal IGF2 expression decrease but unchanged maternal IGF2 expression because of the absence of functional ENH sequences. Arrows indicates positive regulations, whereas lines with bars correspond to inhibitions.

References

    1. Adriaenssens, E., L. Dumont, S. Lottin, D. Bolle, A. Leprêtre, A. Delobelle, F. Bouali, T. Dugimont, J. Coll, and J. J. Curgy. 1998. H19 overexpression in breast adenocarcinoma stromal cells is associated with tumor values and steroid receptor status but independent of p53 and Ki-67 expression. Am. J. Pathol. 1531597-1607. - PMC - PubMed
    1. Ainscough, J. F., T. Koide, M. Tada, S. Barton, and M. A. Surani. 1997. Imprinting of IGF2 and H19 from a 130-kb YAC transgene. Development 1243621-3632. - PubMed
    1. Berteaux, N., S. Lottin, D. Monté, S. Pinte, B. Quatannens, J. Coll, H. Hondermarck, J. J. Curgy, T. Dugimont, and E. Adriaenssens. 2005. H19 mRNA-like noncoding RNA promotes breast cancer cell proliferation through positive control by E2F1. J. Biol. Chem. 28029625-29636. - PubMed
    1. Bestor, T. H. 2000. The DNA methyltransferases of mammals. Hum. Mol. Genet. 92395-2402. - PubMed
    1. Brannan, C. I., E. C. Dees, R. S. Ingram, and S. M. Tilghman. 1990. The product of the H19 gene may function as an RNA. Mol. Cell. Biol. 1028-36. - PMC - PubMed

Publication types

MeSH terms