

MYH9 is a major-effect risk gene for focal segmental glomerulosclerosis
- PMID: 18794856
- PMCID: PMC2827354
- DOI: 10.1038/ng.226
MYH9 is a major-effect risk gene for focal segmental glomerulosclerosis
Abstract
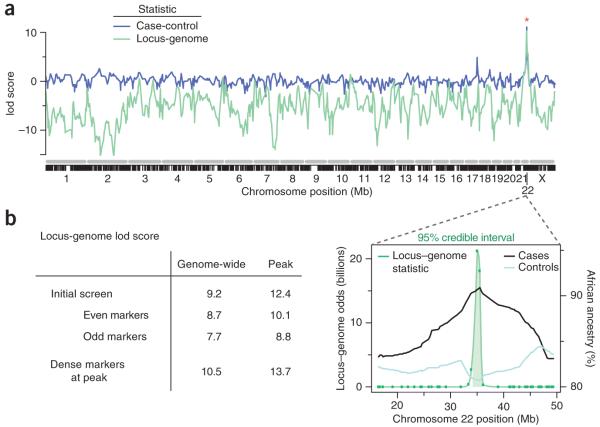
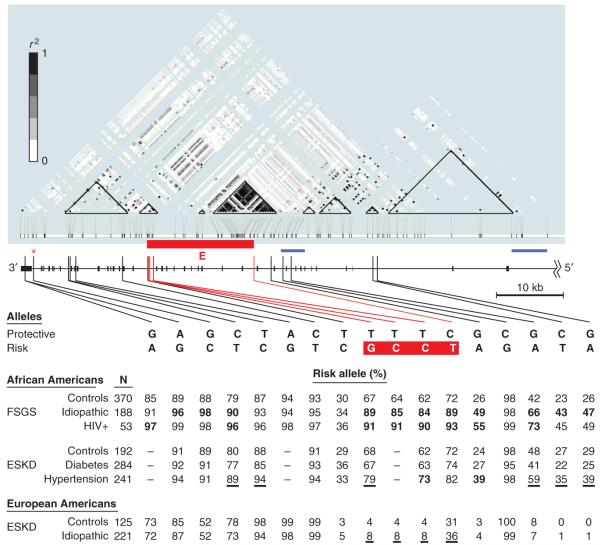
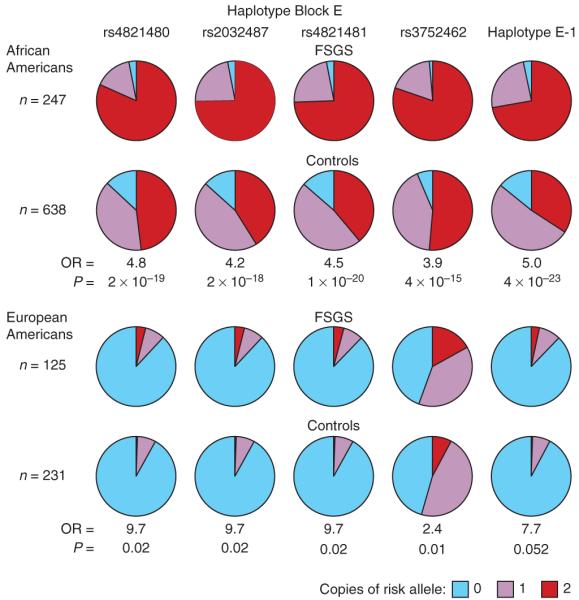
The increased burden of chronic kidney and end-stage kidney diseases (ESKD) in populations of African ancestry has been largely unexplained. To identify genetic variants predisposing to idiopathic and HIV-1-associated focal segmental glomerulosclerosis (FSGS), we carried out an admixture-mapping linkage-disequilibrium genome scan on 190 African American individuals with FSGS and 222 controls. We identified a chromosome 22 region with a genome-wide logarithm of the odds (lod) score of 9.2 and a peak lod of 12.4 centered on MYH9, a functional candidate gene expressed in kidney podocytes. Multiple MYH9 SNPs and haplotypes were recessively associated with FSGS, most strongly a haplotype spanning exons 14 through 23 (OR = 5.0, 95% CI = 3.5-7.1; P = 4 x 10(-23), n = 852). This association extended to hypertensive ESKD (OR = 2.2, 95% CI = 1.5-3.4; n = 433), but not type 2 diabetic ESKD (n = 476). Genetic variation at the MYH9 locus substantially explains the increased burden of FSGS and hypertensive ESKD among African Americans.
Figures
Comment in
-
Kidney disease and African ancestry.Nat Genet. 2008 Oct;40(10):1145-6. doi: 10.1038/ng1008-1145. Nat Genet. 2008. PMID: 18818713 No abstract available.
-
The genetic basis of kidney disease risk in African Americans: MYH9 as a new candidate gene.Am J Kidney Dis. 2009 Apr;53(4):579-83. doi: 10.1053/j.ajkd.2009.02.005. Am J Kidney Dis. 2009. PMID: 19324247 No abstract available.
References
-
- Coresh J, et al. Prevalence of chronic kidney disease in the United States. J. Am. Med. Assoc. 2007;298:2038–2047. - PubMed
-
- Kiberd BA, Clase CM. Cumulative risk for developing end-stage renal disease in the US population. J. Am. Soc. Nephrol. 2002;13:1635–1644. - PubMed
-
- Cowie CC, et al. Disparities in incidence of diabetic end-stage renal disease according to race and type of diabetes. N. Engl. J. Med. 1989;321:1074–1079. - PubMed
-
- Toto RD. Proteinuria and hypertensive nephrosclerosis in African Americans. Kidney Int. Suppl. 2004;66:S102–S104. - PubMed
-
- Fernandez M, et al. A multiethnic, multicenter cohort of patients with systemic lupus erythematosus (SLE) as a model for the study of ethnic disparities in SLE. Arthritis Rheum. 2007;57:576–584. - PubMed
Publication types
MeSH terms
Substances
Grants and funding
LinkOut - more resources
Full Text Sources
Other Literature Sources
Molecular Biology Databases
Miscellaneous
