. 2008 Oct 7;47(40):10587-99.
doi: 10.1021/bi8007033. Epub 2008 Sep 17.

Role of the N- and C-lobes of calmodulin in the activation of Ca(2+)/calmodulin-dependent protein kinase II

Affiliations

Role of the N- and C-lobes of calmodulin in the activation of Ca(2+)/calmodulin-dependent protein kinase II

Amelie Forest et al. Biochemistry. .

Abstract

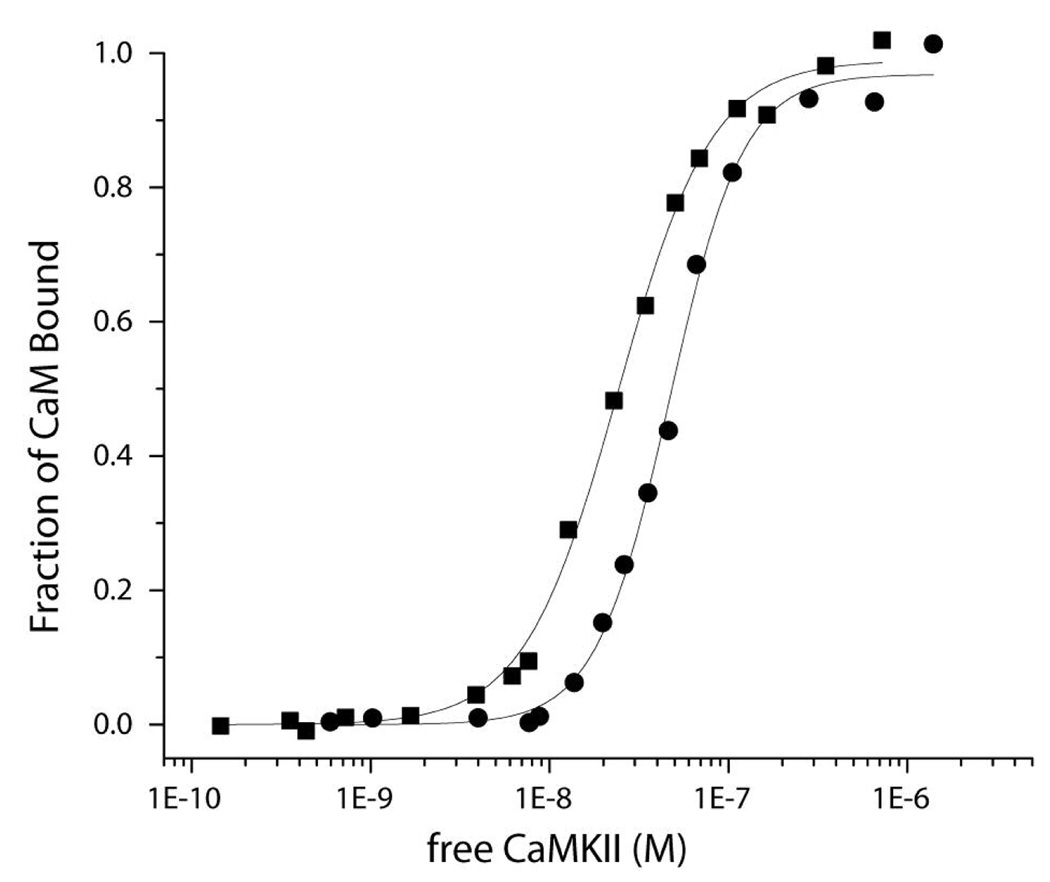
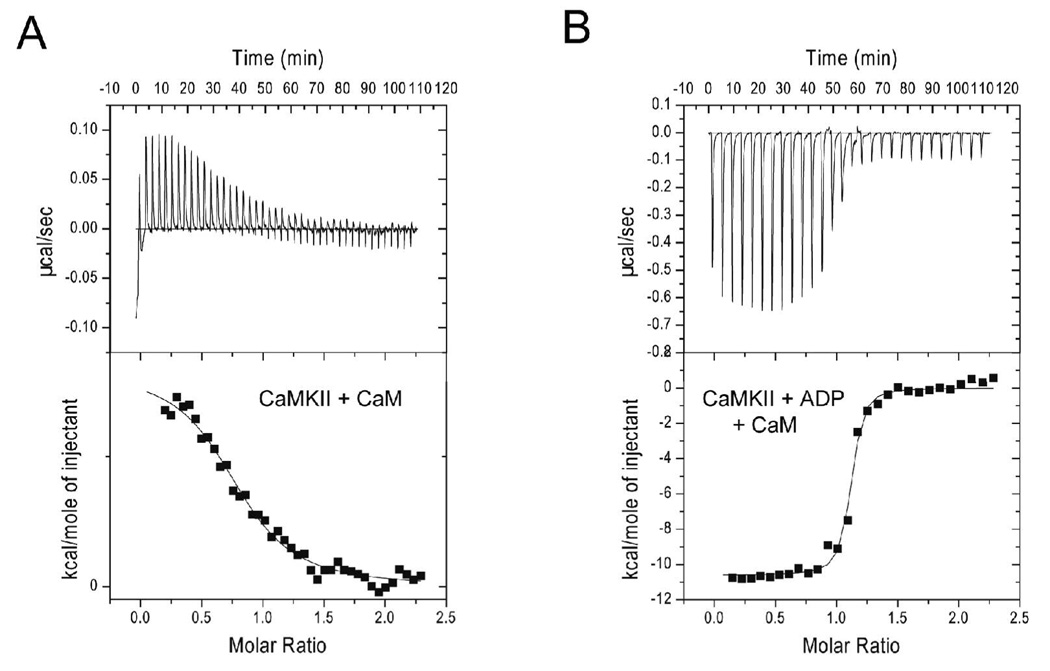
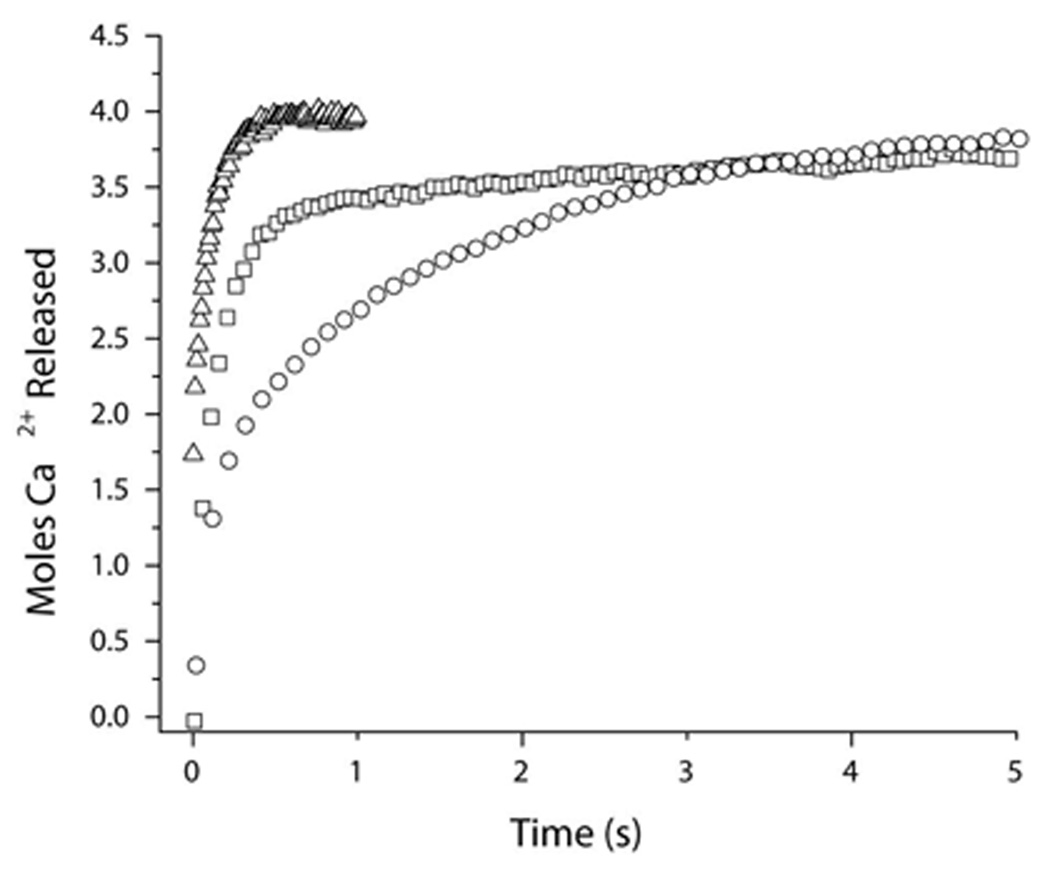
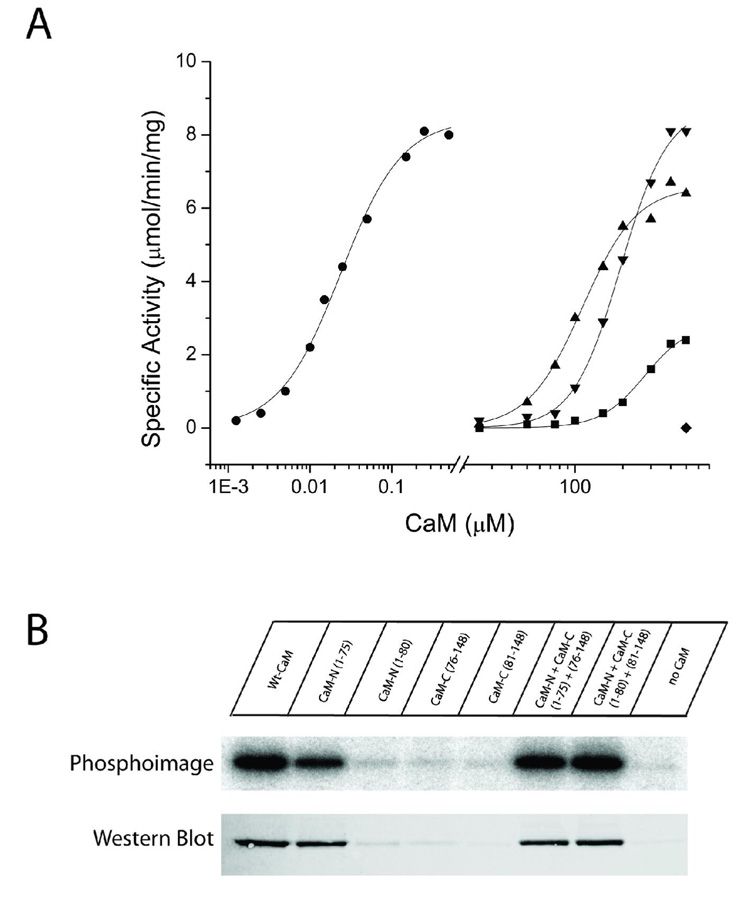
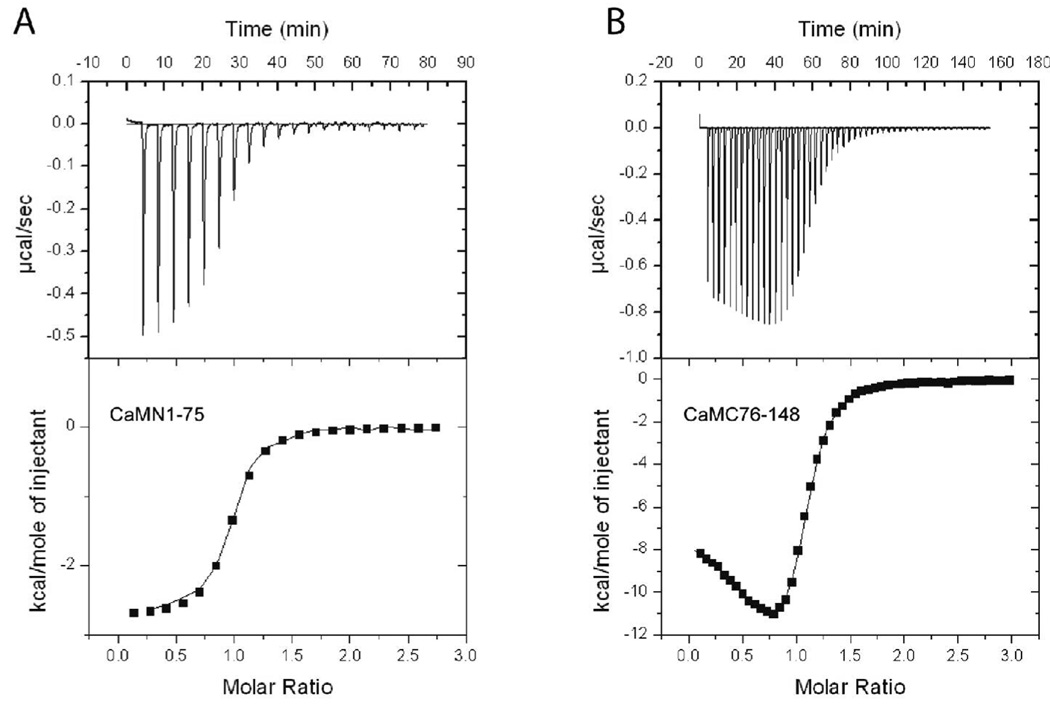
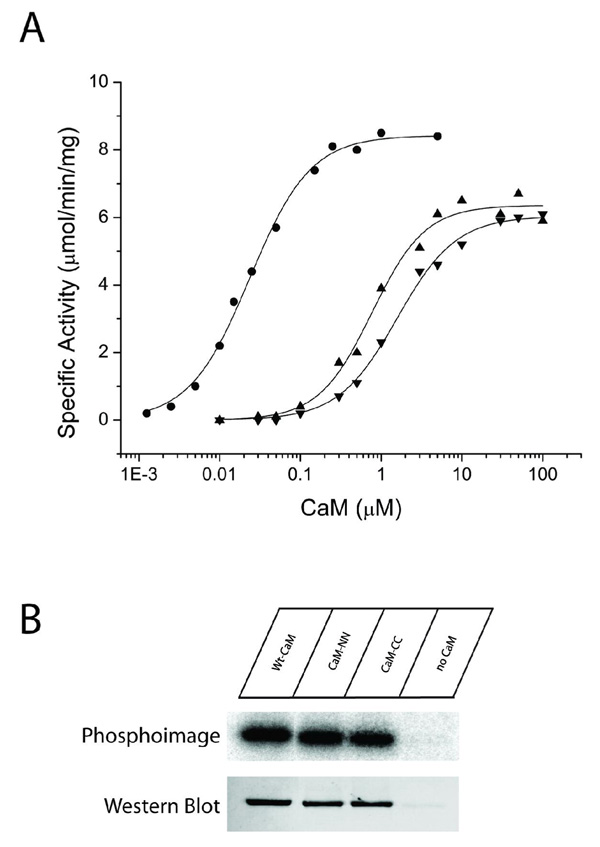
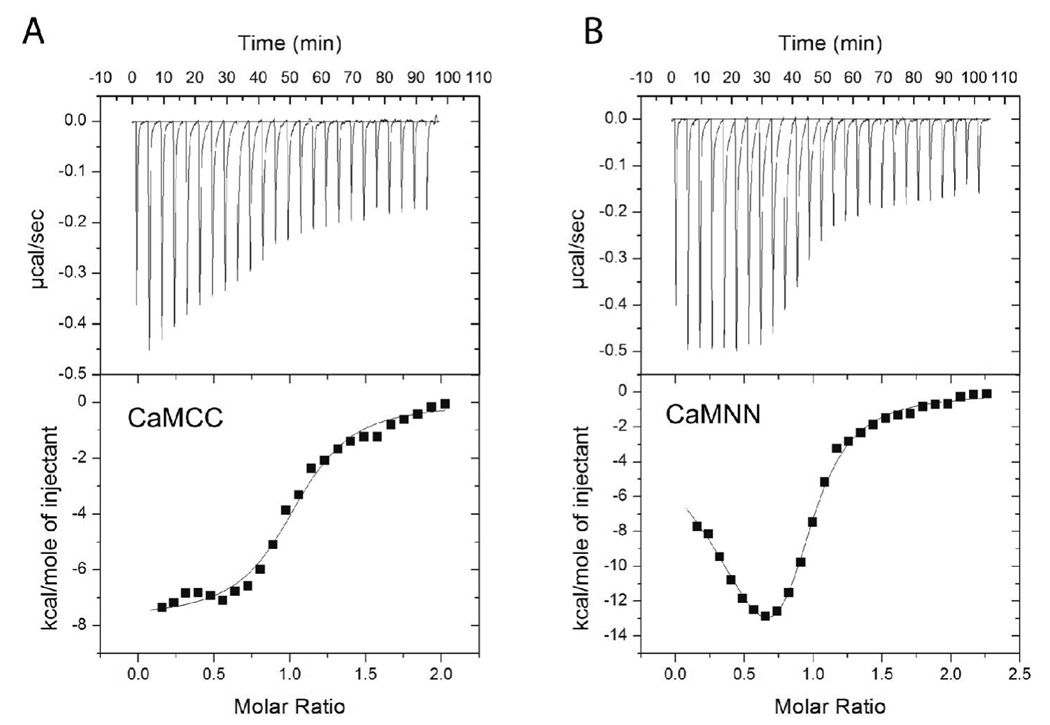
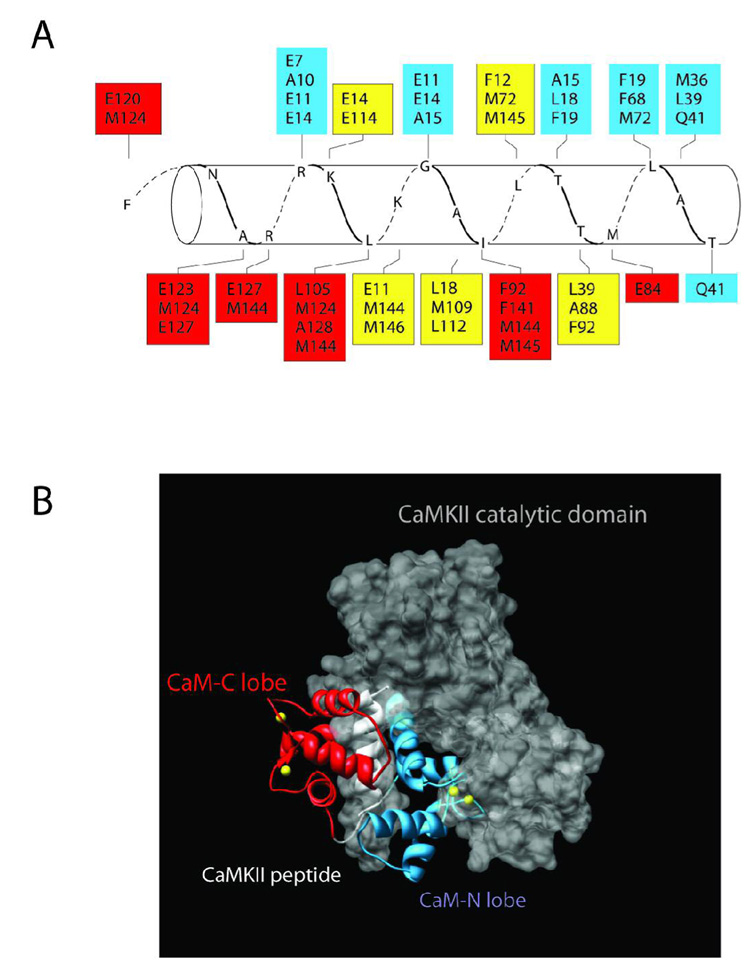
Understanding the principles of calmodulin (CaM) activation of target enzymes will help delineate how this seemingly simple molecule can play such a complex role in transducing Ca (2+)-signals to a variety of downstream pathways. In the work reported here, we use biochemical and biophysical tools and a panel of CaM constructs to examine the lobe specific interactions between CaM and CaMKII necessary for the activation and autophosphorylation of the enzyme. Interestingly, the N-terminal lobe of CaM by itself was able to partially activate and allow autophosphorylation of CaMKII while the C-terminal lobe was inactive. When used together, CaMN and CaMC produced maximal CaMKII activation and autophosphorylation. Moreover, CaMNN and CaMCC (chimeras of the two N- or C-terminal lobes) both activated the kinase but with greater K act than for wtCaM. Isothermal titration calorimetry experiments showed the same rank order of affinities of wtCaM > CaMNN > CaMCC as those determined in the activity assay and that the CaM to CaMKII subunit binding ratio was 1:1. Together, our results lead to a proposed sequential mechanism to describe the activation pathway of CaMKII led by binding of the N-lobe followed by the C-lobe. This mechanism contrasts the typical sequential binding mode of CaM with other CaM-dependent enzymes, where the C-lobe of CaM binds first. The consequence of such lobe specific binding mechanisms is discussed in relation to the differential rates of Ca (2+)-binding to each lobe of CaM during intracellular Ca (2+) oscillations.


Figures

Figure 1
Figure 1
Steady-state fluorescence to assess the role of nucleotide binding of CaM to CaMKII. Shown are the binding curves produced by adding increasing concentrations of CaMKII into a cuvette containing CaM-C75-DANS (100 nM for no nucleotide and 25 nM with nucleotide) in 25 mM MOPS, pH 7.0, 150 mM KCl, 0.5 mM CaCl2 containing 0.1 mg/ml bovine serum albumin. The fraction of CaM bound is plotted against the concentration of free CaMKII. The black dots are titrations in the absence of ADP and the black squares are in the presence of 5 mM MgCl2 and 0.25 mM ADP. The fits are to the Hill equation as described in Methodology.
Figure 2
Figure 2
Calorimetric data for CaM-binding to CaMKII. The data shown represents the binding of wtCaM to CaMKII in the absence (A) or presence (B) of 1 mM ADP at 15°C. The top panel shows the raw power output (µcal/sec) per unit time. The bottom panel shows the integrated data. The solid line through the data represents the nonlinear least squares best fit of the data to a 1:1 binding model as described in Materials and Methods. The best fit parameters for these titration are the following: CaM with no ADP: N = 0.823, Kd = 1.9 µM, ΔH = 1.7 kcal/mol. CaM with ADP: N = 1.08, Kd = 38 nM, ΔH = −11.1 kcal/mol.
Figure 3
Figure 3
Stopped-flow analysis of Ca2+-dissociation from CaM in the presence of CaMKII with or without ADP. Ca2+ dissociation from CaM was measured by monitoring changes in Quin-2 fluorescence in an Applied Photophysics Ltd. model SV.17MV stopped-flow spectrofluorimeter at 22°C. 2 µM CaM, 20 µM CaCl2 in 20 mM MOPS pH 7.0, 100 mM KCl, 1 mM MgCl2, without (triangles) or with 2 µM CaMKII (squares) or CaMKII + 1 mM ADP (circles) was rapidly mixed with 150 µM Quin-2. Quin-2 was excited at 334.5 nm and emission was monitored through a 435 nm cut-on filter. The representative traces shown are averages of 5 runs each. The data were converted to mol Ca2+ released/mol CaM by assuming that the amplitude of Ca2+ release from CaM alone was equal to the release of 2 mol of Ca2+.
Figure 4
Figure 4
Substrate phosphorylation and autophosphorylation induced by half-CaMs. A) Each CaM variant was assessed for its ability to activate CaMKII in reactions containing 25 mM HEPES, pH 7.4, 50 mM KCl, 0.4 mM DTT, 10 mM MgCl2, 4 mM CaCl2, 100 µM ATP, 50 µM syntide, and 2 µCi of 32P-ATP. Reactions were initiated by the addition of 10 ng of CaMKII, incubated for 1 min at 30°C, and terminated by spotting an aliquot on P81 paper and plunging the paper into phosphoric acid. Each reaction was performed in duplicate and separate experiments were repeated a minimum of 2 times. The CaM constructs shown are: wtCaM (circles), CaMN1–75 (squares), CaMN1–75 + CaM 76–148 (triangles), CaMN1–80 + CaMC81–148 (upside down triangles). CaMN1–80, CaMC76–148 and CaMC81–148 were inactive up to the indicated concentration (diamond). B) Each CaM variant was assessed for its ability to induce autophosphorylation of CaMKII. The reaction mixture contained 25 mM HEPES, pH 7.4, 50 mM KCl, 0.4 mM DTT, 10 mM MgCl2, 4 mM CaCl2, 100 µM ATP, and 2 µCi of 32P-ATP. Reactions were initiated by the addition of 100 ng of CaMKII and were allowed to react for 10 min on ice. The reactions were terminated by the addition of SDS-sample buffer and 40 ng of CaMKII from each reaction were loaded and run on a 10% SDS-PAGE gel. Following electrophoresis, staining and destaining, 32P incorporation was assessed by exposing the gel to a phosphor screen for 5 hr and then analyzing the screen on a Typhoon imaging system. Identical samples were also analyzed by Western blot with a rabbit polyclonal antibody specific for phospho-Thr286. The primary antibody was detected with an Alexa568-labeled anti-rabbit antibody and the signal detected using the fluorescence mode of the Typhoon imaging system.
Figure 5
Figure 5
Calorimetric data for binding of lobes of CaM to CaMKII peptide. The data shown represent binding of (A) CaMN1–75 to CaMKII(291–312) at 25°C and (B) CaMC76–148 to CaMKII(291–312) at 25°C. The top panel shows the raw power output (µcal/sec) per unit time. The bottom panel shows the integrated data. The solid line through the data represents the nonlinear least squares best fit of the data to a 2:1 binding model as described in Materials and Methods. The best fit parameters for these titration are the following: CaMN1–75: Kd = 360 nM, ΔH = −2.5 kcal/mol. CaMC76–148: Kd1 = 120 nM, Kd2 = 11900 nM, ΔH1 = −11.8 kcal/mol, ΔH2 = 4.7 kcal/mol.
Figure 6
Figure 6
Substrate phosphorylation and autophosphorylation induced by full-length CaM variants. A) Each CaM variant was assessed for its ability to activate CaMKII exactly as previously described in figure legend 3. The CaM variants shown are: wtCaM (circles), CaMNN (triangles), and CaMCC (upside down triangles). B) Each CaM variant was assessed for its ability to induce autophosphorylation of CaMKII exactly as previously described in figure legend 3. The top panel shows an autoradiograph of 32P incorporation and the bottom panel is a blot immuno-stained with a phospho-Thr286 specific monoclonal antibody.
Figure 7
Figure 7
Calorimetric data for binding of CaMCC and CaMNN to CaMKII. The data shown represents the binding of (A) CaMCC or (B) CaMNN to CaMKII in the presence of 1 mM ADP at 15°C. The top panel shows the raw power output (µcal/sec) per unit time. The bottom panel shows the integrated data. The solid line through the data represents the nonlinear least squares best fit of the data to a one site binding model (for CaMCC) or a two site binding model (CaMNN) as described in Materials and Methods. The best fit parameters for these titration are the following: CaMCC: N = 0.979, Kd = 360 nM, ΔH = −7.3 kcal/mol. CaMNN: N1 = 0.36, N2 = 0.61, Kd1 = 18 nM, Kd2 = 360 nM, ΔH1 = −6.3 kcal/mol, ΔH2 = −14.7 kcal/mol.
Figure 8
Figure 8
Structure and Model of Ca2+/CaM bound to CaMKII. A) Amino acids in CaM are shown in boxes that interact with residues of the peptide (CKII 293–314) that mimics the CaM-binding domain of CaMKII. The residues in red are from the C-terminal domain of CaM, blue are from the N-terminal domain and yellow are from both N- and C-domains. The crystal structure that this figure is based upon is derived from PDB # 1CM1 (20). B) The complete crystal structure of PDB #1CM1 was aligned into the crystal structure of the autoinhibited catalytic domain of CaMKII (PDB# 2BDW) (41). The amino acids of the peptide were superimposed on those same residues in the CaM-binding domain of the catalytic domain as a means of constraining the alignment. The backbone of the C-lobe and N-lobes of CaM are shown in red and blue, respectively. The peptide (CKII 293–314) is in white and the catalytic domain is shown as a space filling model in grey. The yellow balls represent Ca2+ ions. Note that the N-lobe lies in a crevice between the autoregulatory domain and the catalytic domain. This figure was created using Chimera (http://www.cgl.ucsf.edu/chimera/).

References

    1. Hudmon A, Schulman H. Neuronal CA2+/calmodulin-dependent protein kinase II: the role of structure and autoregulation in cellular function. Annu Rev Biochem. 2002;71:473–510. - PubMed
    1. Kolodziej SJ, Hudmon A, Waxham MN, Stoops JK. Three-dimensional reconstructions of calcium/calmodulin-dependent (CaM) kinase IIalpha and truncated CaM kinase IIalpha reveal a unique organization for its structural core and functional domains. J Biol Chem. 2000;275:14354–14359. - PubMed
    1. Miller SG, Kennedy MB. Regulation of brain type II Ca2+/calmodulin-dependent protein kinase by autophosphorylation: a Ca2+-triggered molecular switch. Cell. 1986;44:861–870. - PubMed
    1. Meyer T, Hanson PI, Stryer L, Schulman H. Calmodulin trapping by calcium-calmodulin-dependent protein kinase. Science. 1992;256:1199–1202. - PubMed
    1. Waxham MN, Aronowski J, Westgate SA, Kelly PT. Mutagenesis of Thr-286 in monomeric Ca2+/calmodulin-dependent protein kinase II eliminates Ca2+/calmodulin-independent activity. Proc Natl Acad Sci U S A. 1990;87:1273–1277. - PMC - PubMed

Publication types