

Direct characterization of amyloidogenic oligomers by single-molecule fluorescence
- PMID: 18796612
- PMCID: PMC2567173
- DOI: 10.1073/pnas.0803086105
Direct characterization of amyloidogenic oligomers by single-molecule fluorescence
Abstract
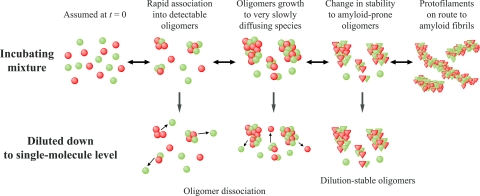
A key issue in understanding the pathogenic conditions associated with the aberrant aggregation of misfolded proteins is the identification and characterization of species formed during the aggregation process. Probing the nature of such species has, however, proved to be extremely challenging to conventional techniques because of their transient and heterogeneous character. We describe here the application of a two-color single-molecule fluorescence technique to examine the assembly of oligomeric species formed during the aggregation of the SH3 domain of PI3 kinase. The single-molecule experiments show that the species formed at the stage of the reaction where aggregates have previously been found to be maximally cytotoxic are a heterogeneous ensemble of oligomers with a median size of 38 +/- 10 molecules. This number is remarkably similar to estimates from bulk measurements of the critical size of species observed to seed ordered fibril formation and of the most infective form of prion particles. Moreover, although the size distribution of the SH3 oligomers remains virtually constant as the time of aggregation increases, their stability increases substantially. These findings together provide direct evidence for a general mechanism of amyloid aggregation in which the stable cross-beta structure emerges via internal reorganization of disordered oligomers formed during the lag phase of the self-assembly reaction.
Conflict of interest statement
The authors declare no conflict of interest.
Figures


Similar articles
-
Protein aggregation and amyloid fibril formation by an SH3 domain probed by limited proteolysis.J Mol Biol. 2003 Nov 14;334(1):129-41. doi: 10.1016/j.jmb.2003.09.024. J Mol Biol. 2003. PMID: 14596805
-
Probing the mechanism of amyloidogenesis through a tandem repeat of the PI3-SH3 domain suggests a generic model for protein aggregation and fibril formation.J Mol Biol. 2006 Feb 10;356(1):189-208. doi: 10.1016/j.jmb.2005.11.034. J Mol Biol. 2006. PMID: 16364365
-
Insights into the origin of the tendency of the PI3-SH3 domain to form amyloid fibrils.J Mol Biol. 2002 Oct 4;322(5):1147-58. doi: 10.1016/s0022-2836(02)00783-0. J Mol Biol. 2002. PMID: 12367534
-
Single Molecule Characterization of Amyloid Oligomers.Molecules. 2021 Feb 11;26(4):948. doi: 10.3390/molecules26040948. Molecules. 2021. PMID: 33670093 Free PMC article. Review.
-
Amyloid oligomers: spectroscopic characterization of amyloidogenic protein states.FEBS J. 2010 Mar;277(6):1380-8. doi: 10.1111/j.1742-4658.2010.07571.x. Epub 2010 Feb 9. FEBS J. 2010. PMID: 20148961 Review.
Cited by
-
The role of amyloidogenic protein oligomerization in neurodegenerative disease.J Mol Med (Berl). 2013 Jun;91(6):653-64. doi: 10.1007/s00109-013-1025-1. Epub 2013 Mar 27. J Mol Med (Berl). 2013. PMID: 23529761 Review.
-
Isolation, characterization, and aggregation of a structured bacterial matrix precursor.J Biol Chem. 2013 Jun 14;288(24):17559-68. doi: 10.1074/jbc.M113.453605. Epub 2013 Apr 30. J Biol Chem. 2013. PMID: 23632024 Free PMC article.
-
Single quantum dot analysis enables multiplexed point mutation detection by gap ligase chain reaction.Small. 2013 Apr 8;9(7):1096-105. doi: 10.1002/smll.201202242. Epub 2012 Dec 13. Small. 2013. PMID: 23239594 Free PMC article.
-
Multiplexed Digital Characterization of Misfolded Protein Oligomers via Solid-State Nanopores.J Am Chem Soc. 2023 Nov 29;145(47):25776-25788. doi: 10.1021/jacs.3c09335. Epub 2023 Nov 16. J Am Chem Soc. 2023. PMID: 37972287 Free PMC article.
-
How Fluorescent Tags Modify Oligomer Size Distributions of the Alzheimer Peptide.Biophys J. 2019 Jan 22;116(2):227-238. doi: 10.1016/j.bpj.2018.12.010. Epub 2018 Dec 19. Biophys J. 2019. PMID: 30638607 Free PMC article.
References
-
- Dobson CM. Protein folding and misfolding. Nature. 2003;426:884–890. - PubMed
-
- Chiti F, Dobson CM. Protein misfolding, functional amyloid, and human disease. Annu Rev Biochem. 2006;75:333–366. - PubMed
-
- Gertz H-J, Siegers A, Kuchinke J. Stability of cell size and nucleolar size in Lewy body containing neurons of substantia nigra in Parkinson's disease. Brain Res. 1994;637:339–341. - PubMed
-
- McLean CA, et al. Soluble pool of Aβ amyloid as a determinant of severity of neurodegeneration in Alzheimer's disease. Ann Neurol. 1999;46:860–866. - PubMed
Publication types
MeSH terms
Substances
Grants and funding
LinkOut - more resources
Full Text Sources
