

Hemodynamic changes after visual stimulation and breath holding provide evidence for an uncoupling of cerebral blood flow and volume from oxygen metabolism
- PMID: 18797471
- PMCID: PMC2865199
- DOI: 10.1038/jcbfm.2008.109
Hemodynamic changes after visual stimulation and breath holding provide evidence for an uncoupling of cerebral blood flow and volume from oxygen metabolism
Abstract
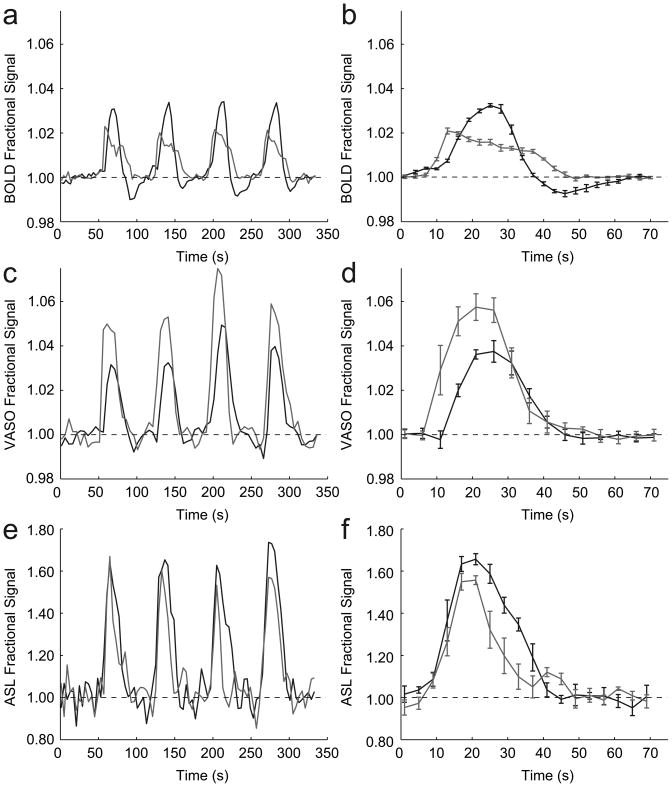
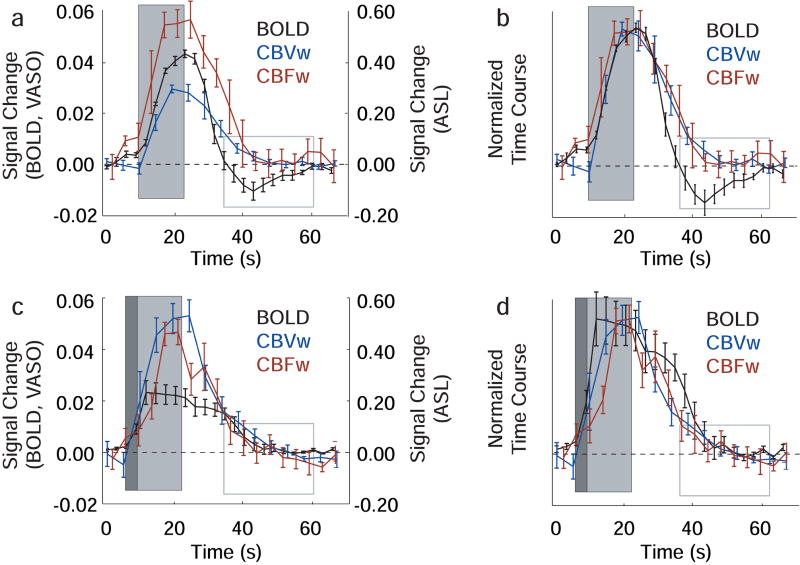
Functional neuroimaging is most commonly performed using the blood-oxygenation-level-dependent (BOLD) approach, which is sensitive to changes in cerebral blood flow (CBF), cerebral blood volume (CBV), and the cerebral metabolic rate of oxygen (CMRO(2)). However, the precise mechanism by which neuronal activity elicits a hemodynamic response remains controversial. Here, visual stimulation (14 secs flashing checkerboard) and breath-hold (4 secs exhale+14 secs breath hold) experiments were performed in alternating sequence on healthy volunteers using BOLD, CBV-weighted, and CBF-weighted fMRI. After visual stimulation, the BOLD signal persisted for 33+/-5 secs (n=9) and was biphasic with a negative component (undershoot), whereas CBV and CBF returned to baseline without an undershoot at 20+/-5 and 20+/-3 secs, respectively. After breath hold, the BOLD signal returned to baseline (23+/-7 secs) at the same time (P>0.05) as CBV (21+/-6 secs) and CBF (18+/-3 secs), without a poststimulus undershoot. These data suggest that the BOLD undershoot after visual activation reflects a persistent increase in CMRO(2). These observations support the view that CBV and CBF responses elicited by neuronal activation are not necessarily coupled to local tissue metabolism.
Conflict of interest statement
The National Center for Research Resources (NCRR) is a component of the National Institutes of Health (NIH). The contents of the paper are solely the responsibility of the authors and do not necessarily represent the official view of NCRR or NIH. Dr. van Zijl is a paid lecturer for Philips Medical Systems. This arrangement has been approved by Johns Hopkins University in accordance with its conflict of interest policies.
Figures
References
-
- Attwell D, Laughlin SB. An energy budget for signaling in the grey matter of the brain. J Cereb Blood Flow Metab. 2001;21:1133–45. - PubMed
-
- Attwell D, Iadecola C. The neural basis of functional brain imaging signals. Trends Neurosci. 2002;25:621–5. - PubMed
-
- Buxton RB, Wong EC, Frank LR. Dynamics of blood flow and oxygenation changes during brain activation: the balloon model. Magn Reson Med. 1998;39:855–64. - PubMed
-
- Buxton RB, Uludag K, Dubowitz DJ, Liu TT. Modeling the hemodynamic response to brain activation. Neuroimage. 2004;23(Suppl 1):S220–33. - PubMed
-
- Donahue MJ, Lu H, Jones CK, Edden RA, Pekar JJ, van Zijl PC. Theoretical and experimental investigation of the VASO contrast mechanism. Magn Reson Med. 2006a;56:1261–73. - PubMed
Publication types
MeSH terms
Grants and funding
LinkOut - more resources
Full Text Sources
