

Estimating long-term survival of critically ill patients: the PREDICT model
- PMID: 18797505
- PMCID: PMC2528946
- DOI: 10.1371/journal.pone.0003226
Estimating long-term survival of critically ill patients: the PREDICT model
Abstract
Background: Long-term survival outcome of critically ill patients is important in assessing effectiveness of new treatments and making treatment decisions. We developed a prognostic model for estimation of long-term survival of critically ill patients.
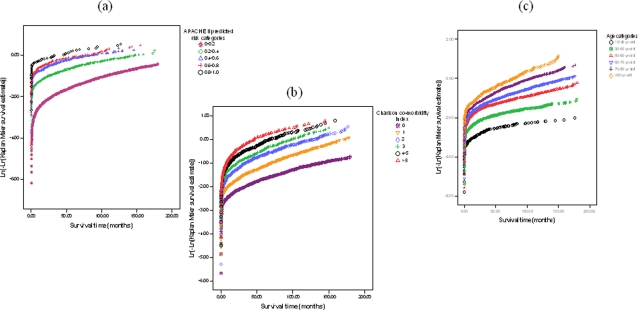
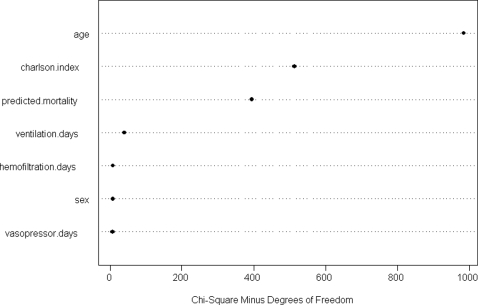
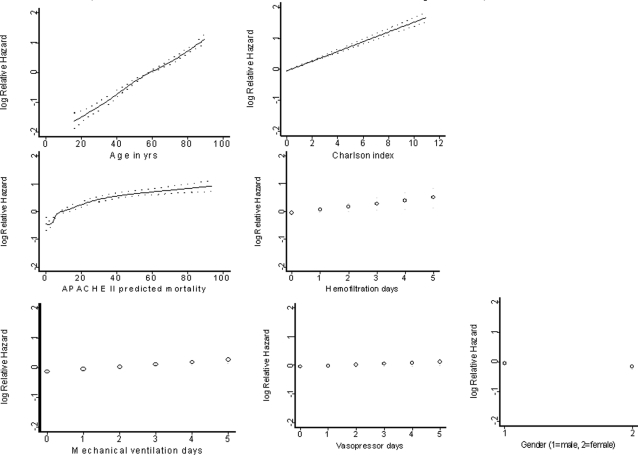
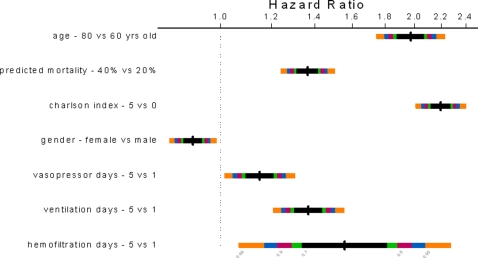
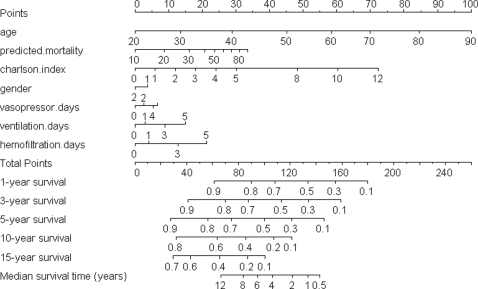
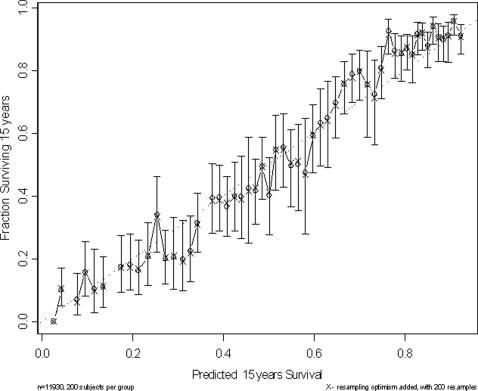
Methodology and principal findings: This was a retrospective linked data cohort study involving 11,930 critically ill patients who survived more than 5 days in a university teaching hospital in Western Australia. Older age, male gender, co-morbidities, severe acute illness as measured by Acute Physiology and Chronic Health Evaluation II predicted mortality, and more days of vasopressor or inotropic support, mechanical ventilation, and hemofiltration within the first 5 days of intensive care unit admission were associated with a worse long-term survival up to 15 years after the onset of critical illness. Among these seven pre-selected predictors, age (explained 50% of the variability of the model, hazard ratio [HR] between 80 and 60 years old = 1.95) and co-morbidity (explained 27% of the variability, HR between Charlson co-morbidity index 5 and 0 = 2.15) were the most important determinants. A nomogram based on the pre-selected predictors is provided to allow estimation of the median survival time and also the 1-year, 3-year, 5-year, 10-year, and 15-year survival probabilities for a patient. The discrimination (adjusted c-index = 0.757, 95% confidence interval 0.745-0.769) and calibration of this prognostic model were acceptable.
Significance: Age, gender, co-morbidities, severity of acute illness, and the intensity and duration of intensive care therapy can be used to estimate long-term survival of critically ill patients. Age and co-morbidity are the most important determinants of long-term prognosis of critically ill patients.
Conflict of interest statement
Figures
References
-
- Acute Health Division DoHS. Melbourne: Department of Human Services; 1997. Review of intensive care in Victoria [Phase 1 report].
-
- Halpern NA, Bettes L, Greenstein R. Federal and nationwide intensive care units and healthcare costs: 1986–1992. Crit Care Med. 1994;22:2001–2007. - PubMed
-
- Kvåle R, Flaatten H. Changes in intensive care from 1987 to 1997 - has outcome improved? A single centre study. Intensive Care Med. 2002;28:1110–1116. - PubMed
-
- Poisal JA, Truffer C, Smith S, Sisko A, Cowan C, et al. Health spending projections through 2016: modest changes obscure part D's impact. Health Aff (Millwood) 2007;26:w242–w253. - PubMed
-
- The Audit Commission. London: Audit Commission for Local Authorities and the National Health Service in England and Wales; 1999. Critical to Success. The place of efficient and effective critical care services within the acute hospital.
Publication types
MeSH terms
LinkOut - more resources
Full Text Sources
