. 2008 Nov;7(11):4756-65.
doi: 10.1021/pr800333e. Epub 2008 Sep 18.

The impact of peptide abundance and dynamic range on stable-isotope-based quantitative proteomic analyses

Affiliations

The impact of peptide abundance and dynamic range on stable-isotope-based quantitative proteomic analyses

Corey E Bakalarski et al. J Proteome Res. 2008 Nov.

Abstract

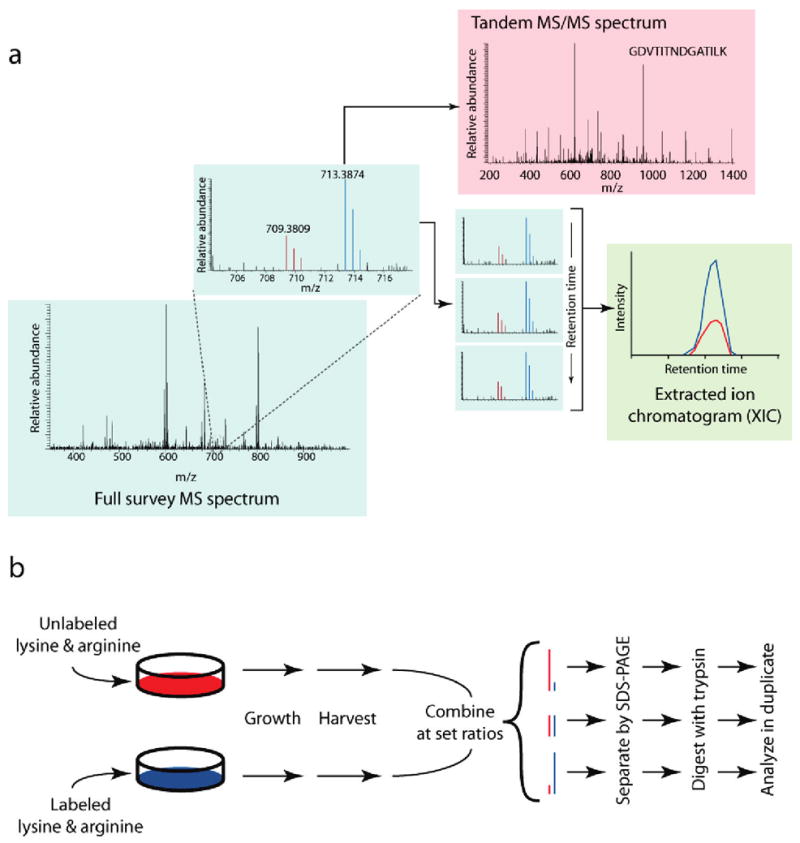
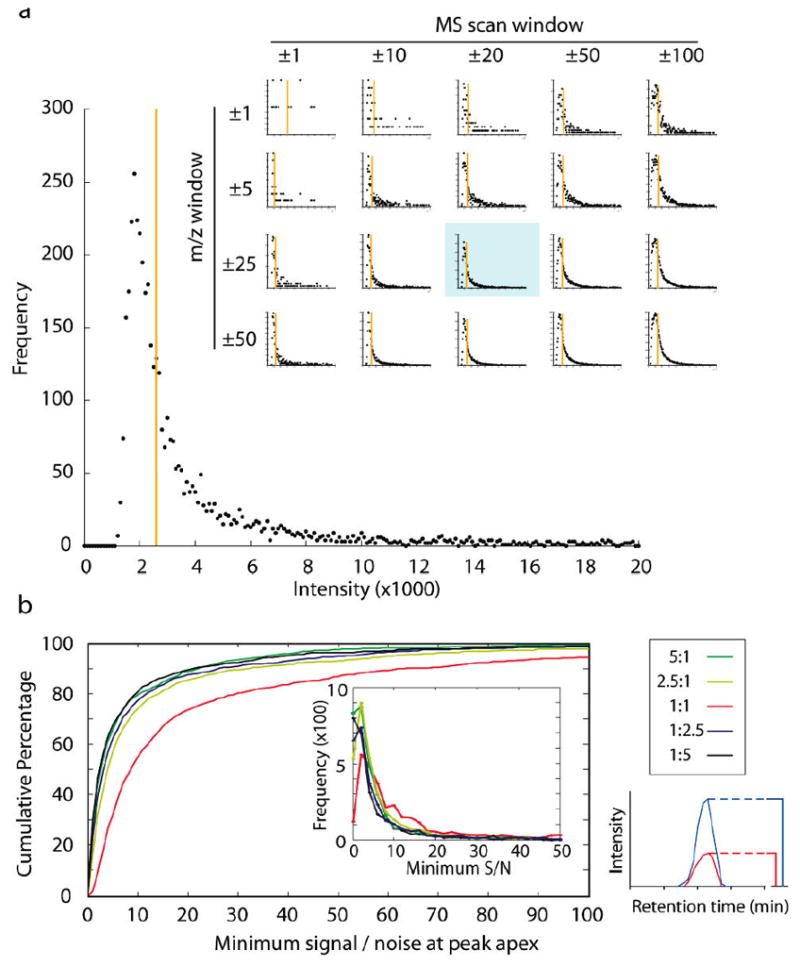
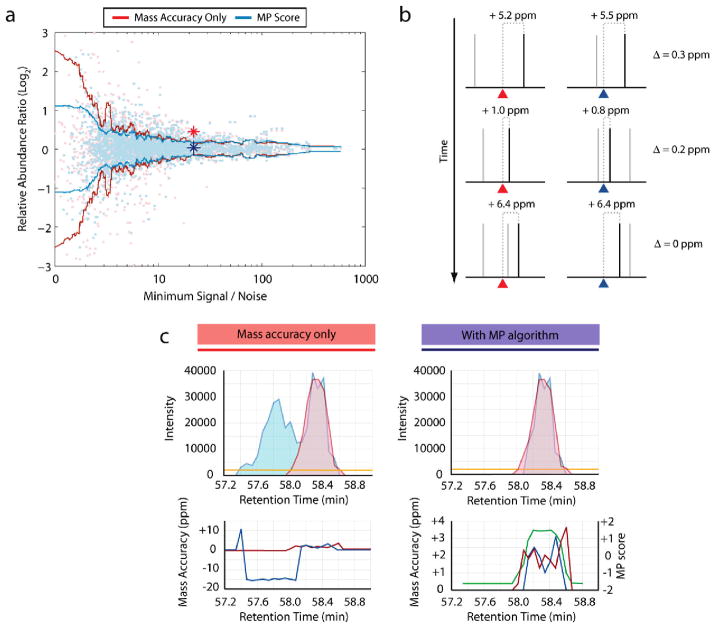
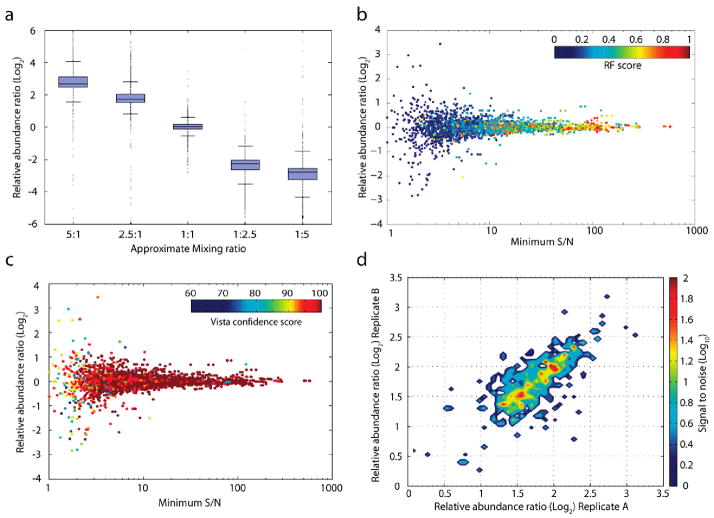
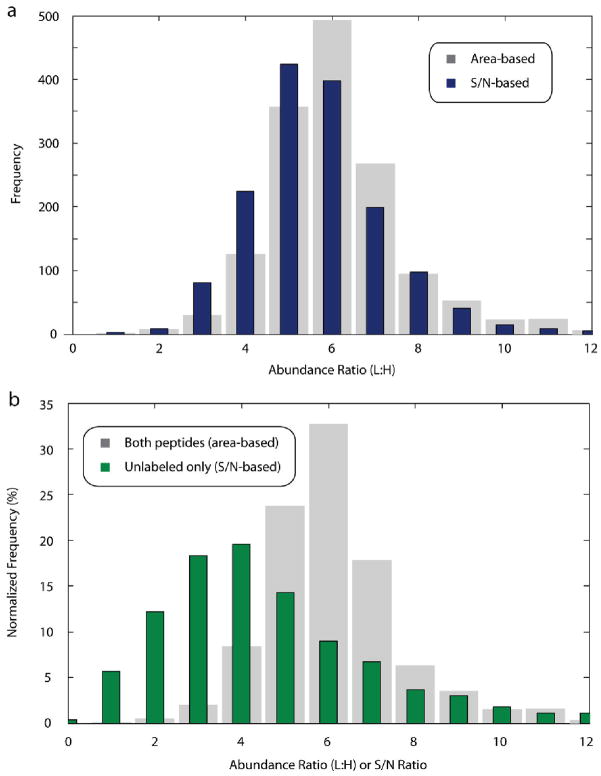
Recently, mass spectrometry has been employed in many studies to provide unbiased, reproducible, and quantitative protein abundance information on a proteome-wide scale. However, how instruments' limited dynamic ranges impact the accuracy of such measurements has remained largely unexplored, especially in the context of complex mixtures. Here, we examined the distribution of peptide signal versus background noise (S/N) and its correlation with quantitative accuracy. With the use of metabolically labeled Jurkat cell lysate, over half of all confidently identified peptides had S/N ratios less than 10 when examined using both hybrid linear ion trap-Fourier transform ion cyclotron resonance and Orbitrap mass spectrometers. Quantification accuracy was also highly correlated with S/N. We developed a mass precision algorithm that significantly reduced measurement variance at low S/N beyond the use of highly accurate mass information alone and expanded it into a new software suite, Vista. We also evaluated the interplay between mass measurement accuracy and S/N; finding a balance between both parameters produced the greatest identification and quantification rates. Finally, we demonstrate that S/N can be a useful surrogate for relative abundance ratios when only a single species is detected.


Figures

Figure 1
Figure 1
Experimental design. (a) Typical workflow for quantitative proteomic methods using stable isotopes. Stable isotope labeling produces two chemically identical peptide pools which differ only in their masses. This difference in mass is easily resolved within the full (MS) survey spectrum (blue box) into separate isotopic envelopes composed of all spectral peaks for the labeled and unlabeled species (red and blue peaks; see inset). To identify the eluting peptide, the mass spectrometer isolates and fragments the peptide ion of either the labeled (blue) or unlabeled (red) species to produce a tandem MS/MS spectrum (red box). The relative spectral peak intensities of both species are culled from successive MS spectra into an extracted ion chromatogram (green box). These chromatographic peaks, when compared across time, correlate with the change in abundance between the two peptide species. (b) Stable-isotope-labeled protein mixtures for testing signal-to-noise and quantitative accuracy. Jurkat lymphoblastic T-cell lines were grown using the SILAC method in two separate cultures differing in their growth media: one culture contained 13C615N2-lysine and 13C615N4-arginine, while the other contained natural forms of these amino acids. Cells were harvested, lysed, and combined at set protein concentration ratios of 5:1, 2.5:1, 1:1, 1:2.5, and 1:5. Sample mixtures were then gel-separated, trypsin-digested and analyzed in duplicate by LC-MS/MS techniques.
Figure 2
Figure 2
Signal-to-noise ratios in an FT-ICR instrument. (a) Spectral peak intensity distribution in FT-ICR MS survey scan data. A histogram of all spectral peak intensity information recorded across a defined retention time (±20 MS scans; 46.3–48.7 min) and mass range (±25 m/z; 675–725 m/z) from an 80-min analysis illustrates the distribution of peaks arising from both signal and noise, binned at 100 intensity unit increments. Noise peaks tend to appear with similar intensities, producing a large spike in frequency at the lower end of the intensity range. While the definition of the graph can be controlled by varying the time and mass windows examined (inset), the median value (orange bar) remains similar. (The blue-shaded graph in the inset is the same as the larger graph within the figure.) (b) Most complex-mixture peptide identifications from an FT-ICR instrument are at low signal-to-noise. A single 80-min LC-MS/MS analysis of a 1:1 mixture (Figure 1b) generated more than 3000 confident peptide identifications. However, the majority of these peptides were detected with S/N levels of less than 10 in the MS scan, and the median S/N value was only 8.6. Other mixing ratios produced still lower overall S/N distributions with similar numbers of peptides identified. Signal-to-noise values were measured at the chromatographic peak apex; the smaller S/N ratio from either the heavy or light peak was then chosen and plotted (bottom left). Any point along the graph indicates the percentage of peptides identified at or below the given S/N threshold. Graph inset shows a histogram of the S/N distribution of the same 3000 peptide identifications.
Figure 3
Figure 3
A mass precision algorithm improves quantitation accuracy. (a) Standard deviation in ratio measurement as a function of S/N. A moving window (100 samples, centered) of the mean standard deviation from over 3000 observed abundance ratios illustrates the variance in ratio measurements obtained using only a high mass accuracy filter (red line), or through use of a mass precision algorithm (blue line; see text). Relative abundance ratios from the same 1:1 mixture were plotted against the signal-to-noise ratio of the less intense of the heavy or light peptide species. Individual ratio observations are shown as light red (mass accuracy filter) and light blue points (mass precision algorithm). While both approaches performed similarly at higher signal levels, the mass precision score significantly improved accuracy (Ansari-Bradley test: p = 0.0019) when compared to the simple mass window filter at lower signal levels. Blue and red stars indicate S/N and ratio values for the example peptide illustrated in panel c. (b) Mass precision algorithm methodology. The algorithm assesses the similarity in mass accuracy between the light and heavy peptide species. Theoretical masses of the light and heavy peptide peaks are indicated by red and blue triangles, respectively; noise peaks are shown in gray, while peptide peaks are shown in black. Although the peptide peak mass accuracy varies from scan to scan, both species deviate in a similar manner (as indicated by their mass difference from the theoretical mass). Conversely, noise peaks are randomly distributed, distinguishing them from peptide signal. (c) Mass precision algorithm resolves interfering peaks. To calculate the mass precision (MP) score, the mass accuracies of the light and heavy peaks (bottom panels; red and blue lines) were employed to discriminate against noise peaks and to determine chromatographic peak boundaries (see text). Using high mass accuracy as the only filter (top left) permitted a confounding peptide eluting earlier than the target heavy peptide to interfere with quantitation. The mass precision score (bottom right; green line) successfully discriminated between the two sets of spectral peaks so that only the correct peak data was chosen (top right).
Figure 4
Figure 4
Assessing accuracy and reproducibility of quantitation. (a) Measurement accuracy scales linearly over a 10-fold ratio difference. Identical, labeled peptide samples were mixed at five different proportions (5:1 to 1:5) and analyzed in duplicate, producing an average of 2900 successfully quantified peptides per analysis. The variance in each mixture is presented as a box and whisker plot, where the box contains lines denoting the lower quartile, median, and upper quartile values. Whiskers extend to 1.5 times the interquartile range. (b) Distribution of Random Forest classifications as a function of abundance ratio and S/N. Color denotes the Random Forest true class probability (RF Score; see text) that a particular quantitation event from the 1:1 mixture illustrated in Figure 3a is reproducible. The classifier indicates the expectation that a replicate analysis of the same peptide would yield a ratio within 5% of this observation. (c) Distribution of Vista heuristic score classifications. Color denotes the Vista heuristic score (see text) for a particular quantitation event from the same 1:1 mixture illustrated in panel b. The heuristic score is a weighted sample of a series of Boolean predictors to predict reproducibility. (d) Replicate analyses and source of variation in measurement. Replicate analyses from the same biological sample were acquired in two separate instrument runs, and the relative abundance ratios of 1558 peptides identified and quantified in both analyses were plotted against each other on the x- and y-axes. Color indicates the average S/N level of peptides quantified at a particular ratio; ratios were binned into 50 equal increments (0.07 ratio units) and the average S/N level of all binned species is displayed. The spread of peptide quantitation events along a 1:1 identity axis (bottom left to top right) suggests a majority of the variation in ratio measurement was due to factors external to the algorithm or instrument (e.g., biological).
Figure 5
Figure 5
Signal-to-noise measurements provided useful estimations of relative ratio abundance when only one peptide species was present. (a) Comparison of area-based and signal-to-noise-based ratios for peptides where both species were found. For 1522 peptides with high S/N ratios (>15 S/N) from a 1:5 (labeled/unlabeled) mixture where both the labeled and unlabeled species were present, ratios were calculated based on the areas under each extracted ion chromatogram (gray), and by dividing the signal-to-noise ratio of the unlabeled species by that of the labeled species (blue). S/N-based ratios approximated those calculated by the area-based method. (b) Exclusive quantification events reflect minimum changes in abundance. In the same 1:5 mixture as above, signal from the unlabeled peptide species was exclusively detected for 866 peptides. Although the labeled species was not observed, the S/N ratio of the unlabeled species was used as a surrogate for an area-based calculation, allowing the minimum change in abundance to be calculated for these species (green bars). Gray bars depict the same distribution of area-based quantification events from panel a.

References

    1. Matsuoka S, et al. ATM and ATR substrate analysis reveals extensive protein networks responsive to DNA damage. Science. 2007;316:1160–1166. - PubMed
    1. Dengjel J, et al. Quantitative proteomic assessment of very early cellular signaling events. Nat Biotechnol. 2007;25:566–568. - PubMed
    1. Dong MQ, et al. Quantitative mass spectrometry identifies insulin signaling targets in C. elegans. Science. 2007;317:660–663. - PubMed
    1. Ong SE, Foster LJ, Mann M. Mass spectrometric-based approaches in quantitative proteomics. Methods. 2003;29:124–130. - PubMed
    1. Gygi SP, et al. Quantitative analysis of complex protein mixtures using isotope-coded affinity tags. Nat Biotechnol. 1999;17:994–999. - PubMed

Publication types